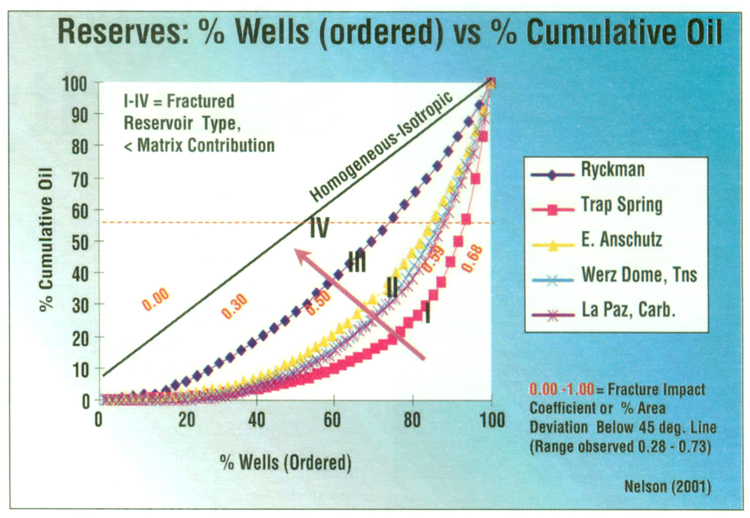
Figure 9. Graph that shows examples from several reservoirs where percentage of wells are ordered from the least to the most productive and the vertical axis is cumulative production. The different fractured reservoir types correlate nicely with these production characteristics and the “fracture impact coefficient.” Our goal is to avoid the scenario of unproductive wells in the lower left corner of the graph by characterizing fractures as early as possible.