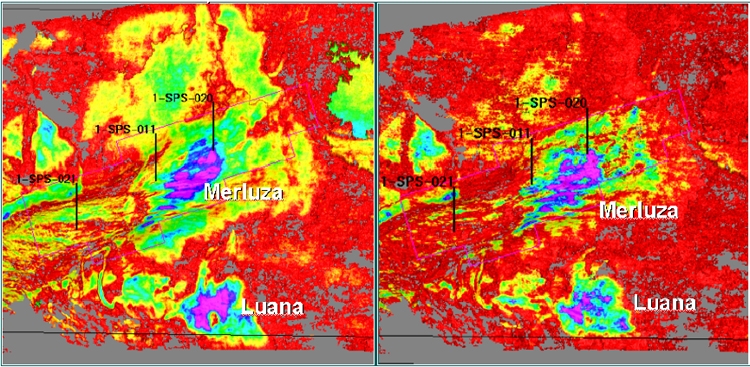
Figure 3. Itajai surface with stack amplitude (left) showing sand distribution, and Fluid Factor amplitude showing potential hydrocarbon distribution (right).
Figure 3. Itajai surface with stack amplitude (left) showing sand distribution, and Fluid Factor amplitude showing potential hydrocarbon distribution (right).