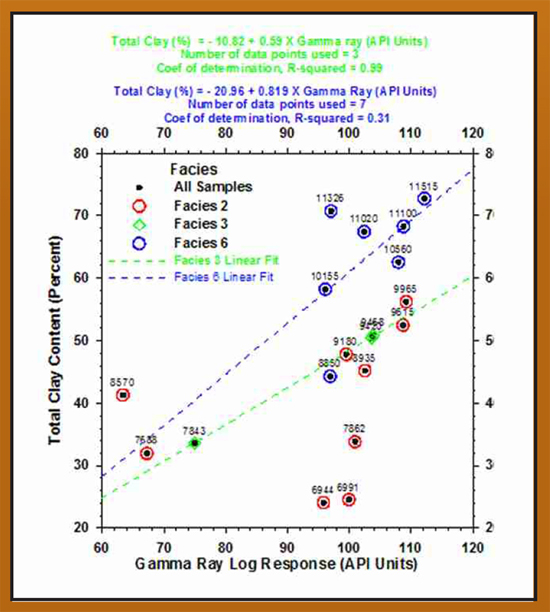
Figure 3-6. Plotting the total clay content against normalized Gamma Ray log response suggests that the two parameters are essentially unrelated for facies 2. Facies 3 and facies 6 display moderate to good correlations between the parameters. Samples labeled by measured depth.