Click image for enlargement.
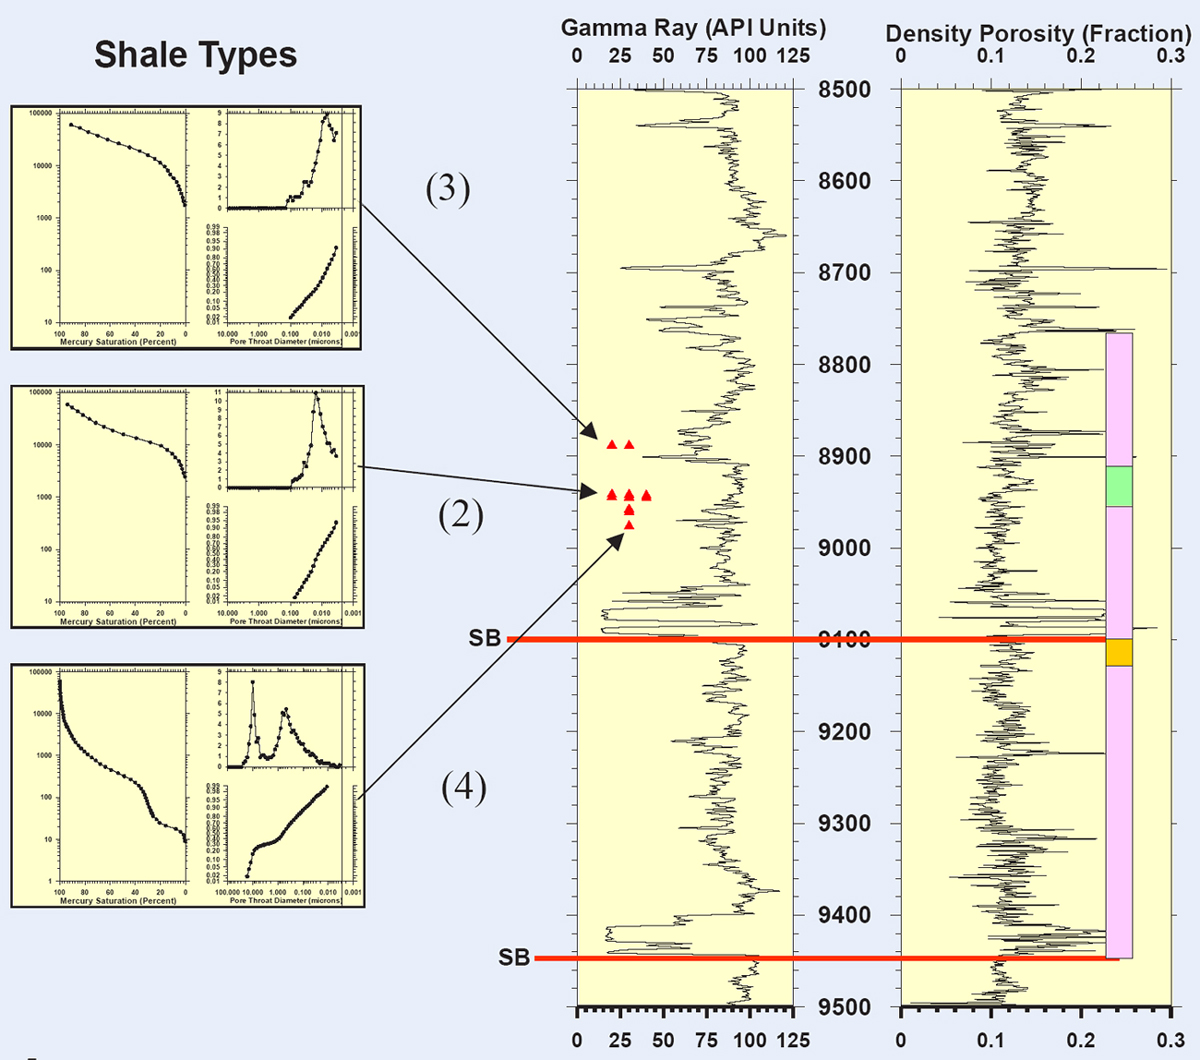
Figure 4-4. Mercury-injection curves (MICP) and plots of pore-throat distribution of three shale types and their stratigraphic positions, as shown on wire-line log.
Click image for enlargement.
Figure 4-4. Mercury-injection curves (MICP) and plots of pore-throat distribution of three shale types and their stratigraphic positions, as shown on wire-line log.