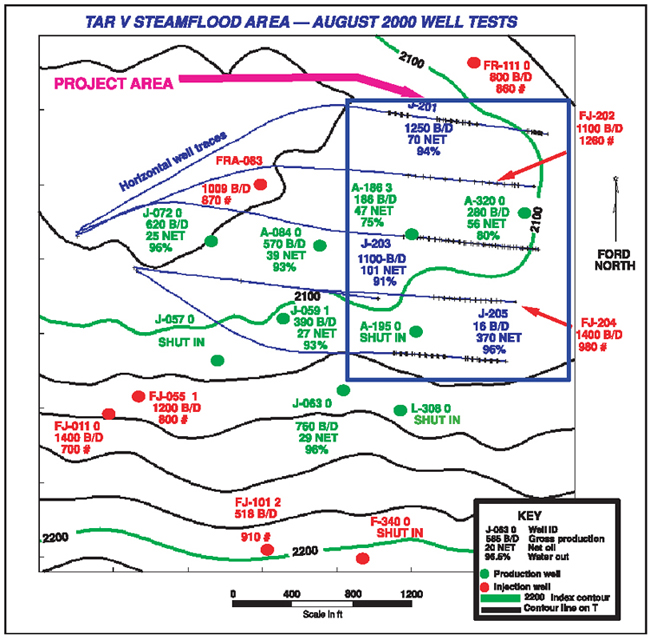
Figure 18. Fault Block V Tar zone waterflood configuration, with production and cut data for August 2000.
Click here to view the changes in production and cut data given in Figures 16, 17, and 18.
Figure 18. Fault Block V Tar zone waterflood configuration, with production and cut data for August 2000.
Click here to view the changes in production and cut data given in Figures 16, 17, and 18.