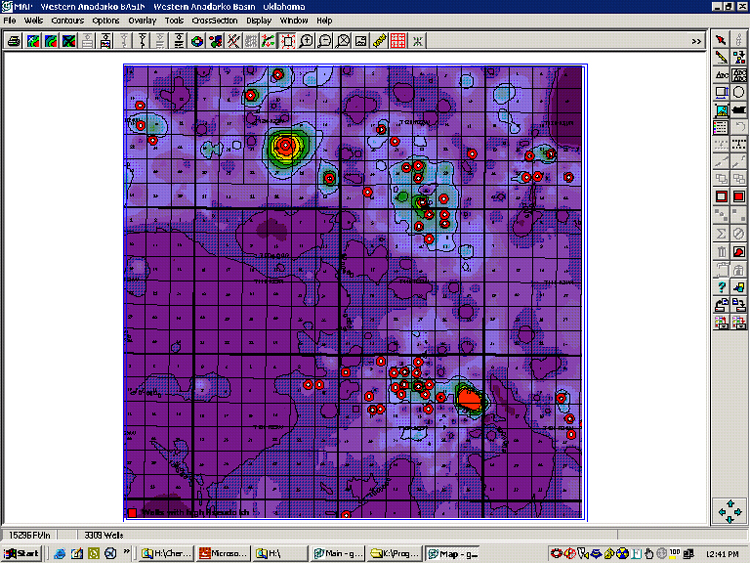
Figure 35. Map of cumulative production for first 24 months of production, along with wells with high pseudo kh (in same area as Figure 29).
Figure 35. Map of cumulative production for first 24 months of production, along with wells with high pseudo kh (in same area as Figure 29).