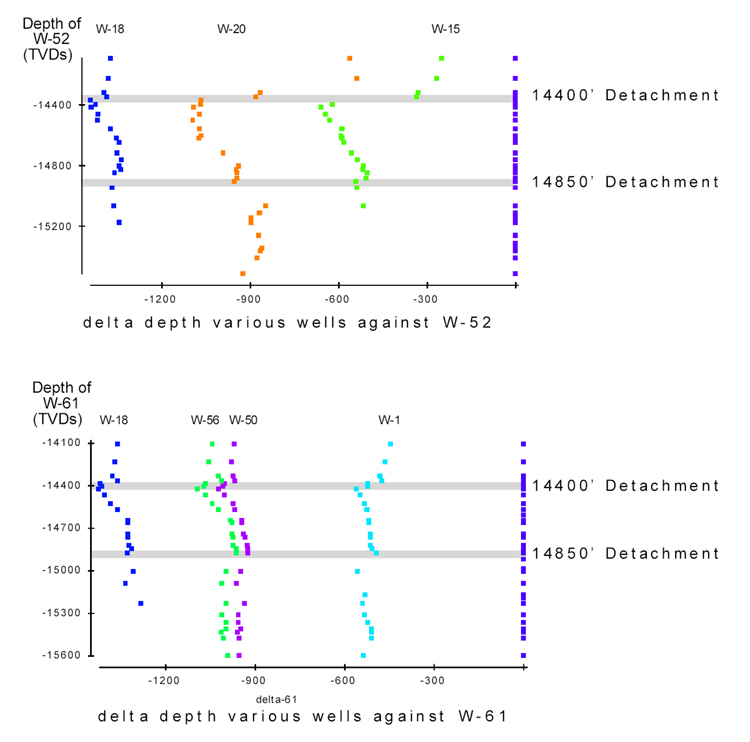
Figure 7.3. Two inverted stacked Bischke plots, with the vertical axis of each being the TVDs of the reference well. This plot is similar to a stratigraphic section. In each plot, detachments are readily indicated by differences in delta depths.
Figure 7.3. Two inverted stacked Bischke plots, with the vertical axis of each being the TVDs of the reference well. This plot is similar to a stratigraphic section. In each plot, detachments are readily indicated by differences in delta depths.