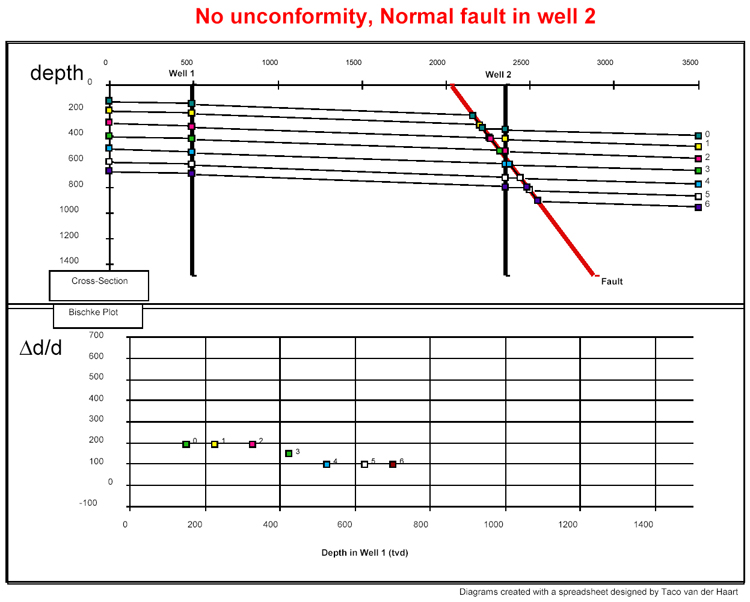
Figure 2.3. Bischke Plot and cross-section, with uniform dip and fault intersecting one well. One interval does not fit the two trends because it is faulted.
Figure 2.3. Bischke Plot and cross-section, with uniform dip and fault intersecting one well. One interval does not fit the two trends because it is faulted.