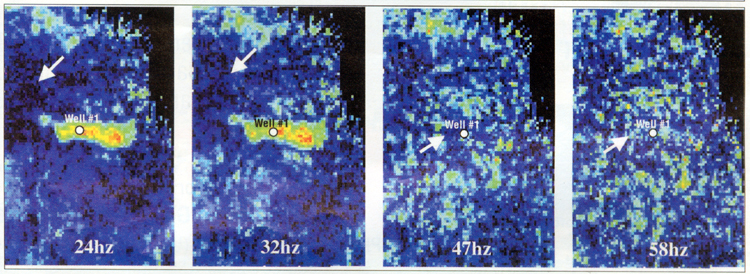
Figure 4. Horizon amplitude maps at four frequencies. Subtle amplitude changes can be seen between 47 and 58 Hz at the arrows. Note the amplitude shadow at 47 Hz associated with the bright amplitude at 32 Hz due to gas pay. This is part of the reflectivity signature of the hydrocarbons. The amplitude shadow at 24 Hz at the arrows is indicative of sand with no hydrocarbons.
Click to view sequence of maps at four frequencies.