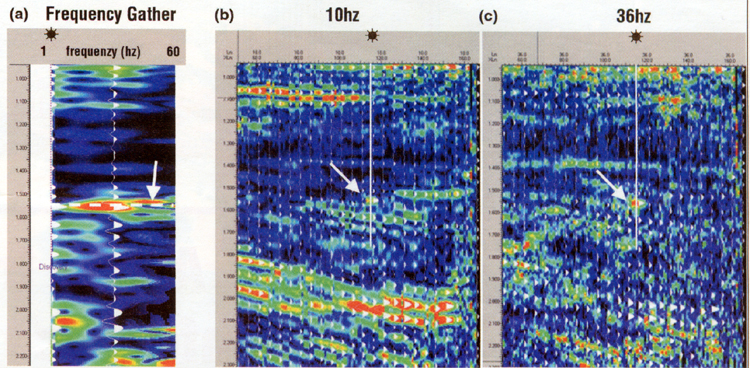
Figure 3a. Frequency gather at the wellbore with the full-spectrum trace as an overlay. The gather shows increasing frequency to the right with warm colors for higher amplitude. Frequency normalization has been used to remove the seismic wavelet. Top of pay zone shown at the dotted white line.
Figure 3b and 3c. Frequency panels of the seismic line shown in Figure 1 at 10 Hz and 36 Hz.
Click to view sequence of frequency panels.