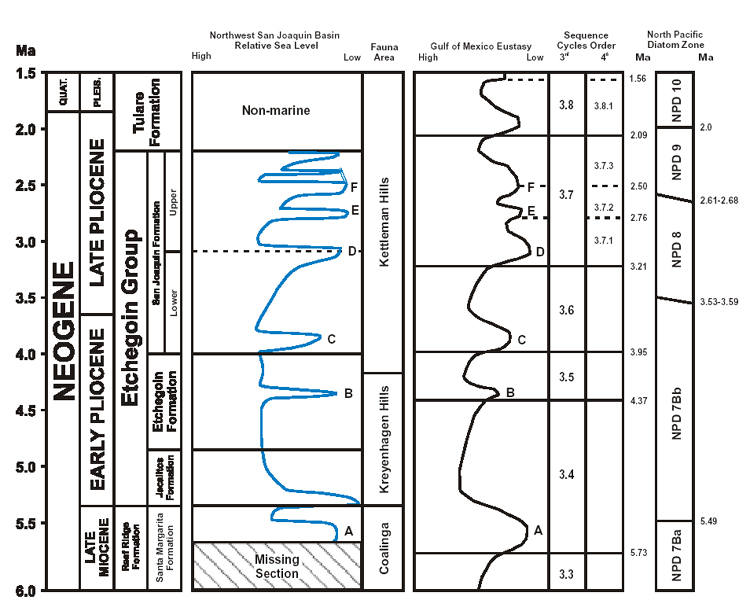
Figure 3. Comparison of the late Neogene northwest San Joaquin Basin relative sealevel curve (this study) to the Gulf of Mexico eustatic curve (Wornardt and Vail, 1991; Wornardt et al., 2001) shows close correlation. Correlative latest Miocene through Late Pliocene lowstands are identified by letters A-F. The timing of lowstand events from this figure were used to refine Santa Margarita Formation and Etchegoin Group chronostratigraphy to construct Figure 4. The correlative North Pacific diatom zones (Maruyama, 2000; see also Figure 1) are shown for reference.