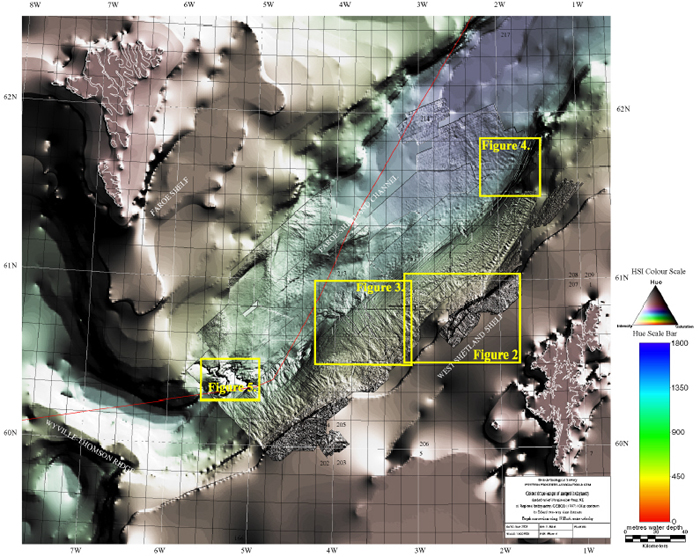
Figure 1. Image of the sea bed, offshore northwest Britain, with detailed expression of depositional and erosional processes. Image generated using ER MAPPER’s ‘shiny” algorithm from surface picks on 3D seismic data; illumination is from the northeast. Figures 2, 3, 4, and 5 are detail panels.