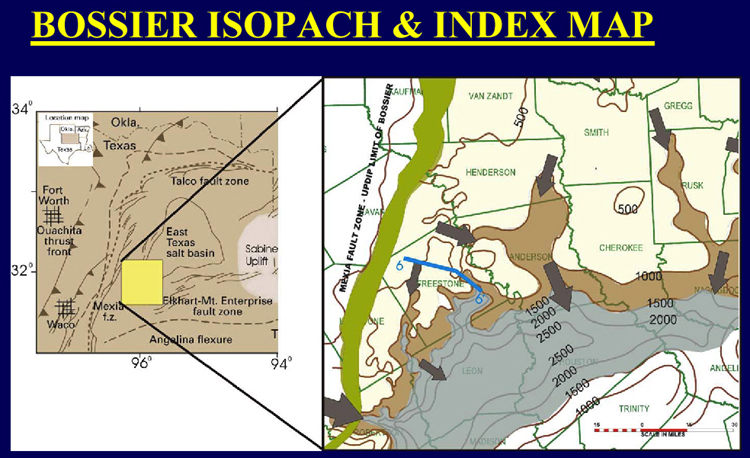
Figure 1. (Left) Bossier study area on map of East Texas Basin showing regional tectonic features (after Montgomery and Karlewicz, 2001). (Right) Isopach map of Bossier Formation, in seven county area and location of Well Log Section 6-6’ (Figure 5). Arrows show interpreted primary route of sand feeder systems. (0–1,000' isopach—Shelf; 1,000–1,500' isopach—Slope; >1,500' isopach—Basin Floor).