Click on image for larger version.
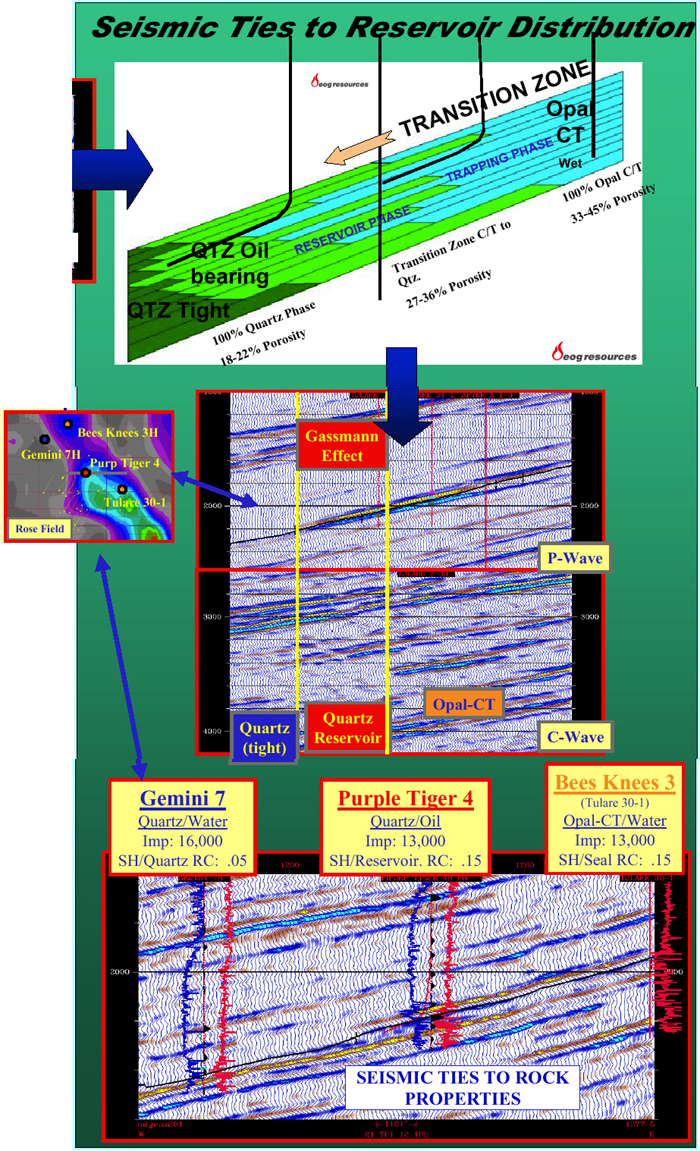
Figure 14. Seismic ties to rock properties. Upper. Diagram of quartz oil-bearing reservoir phase, below the opal CT, trapping phase and above the quartz tight phase. Middle. P-wave and C-wave seismic profiles, Rose Field, with the former showing the Gassmann effect due to change from gas-saturated oil to water and the latter showing the change in silica mineralogy. Lower. Seismic profile, Rose Field area, showing that seismic ties to the rock properties (with discernible differences between the updip opal CT phase, oil-bearing quartz phase, and water-bearing quartz phase.