Click on image to view enlargement.
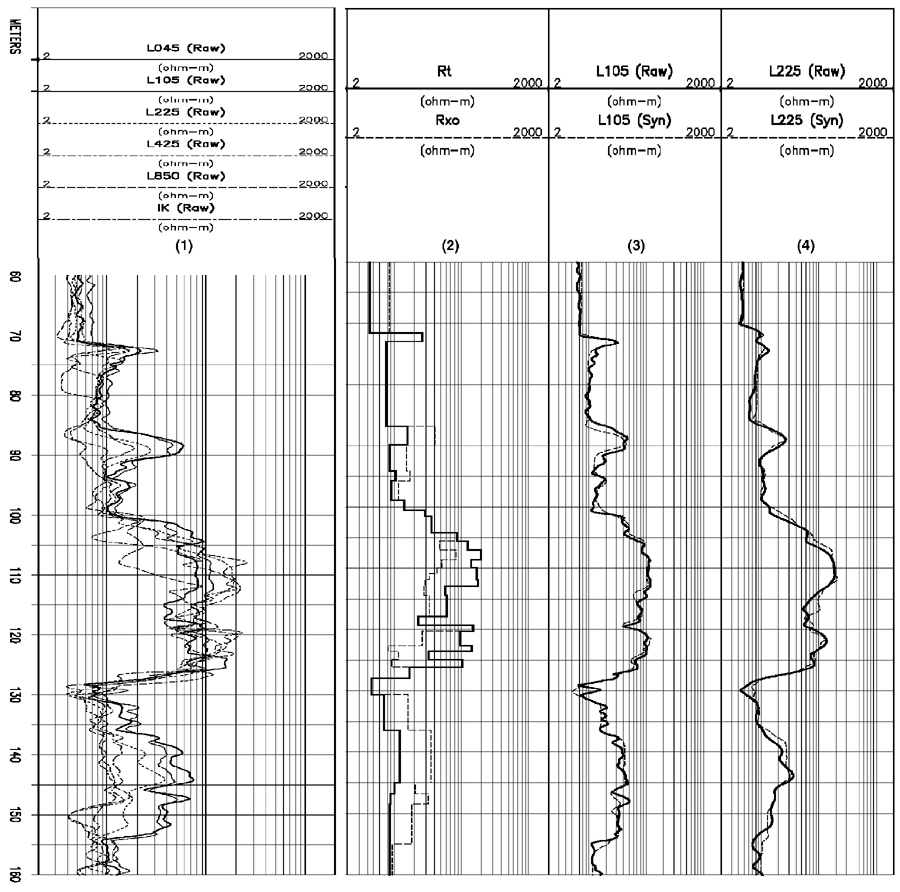
Figure 1. Interpretation results of the BKZ resistivity logs for well WS-1. The raw data are presented in track 1; the 2-D inversion results are in track 2 (dashed curve is resistivity of invaded zone, Rxo; solid curve is resistivity of uncontaminated zone, Rt). Data match between the raw and synthetic L105 and L225 BKZ lateral logs is shown in tracks 3 and 4, respectively.