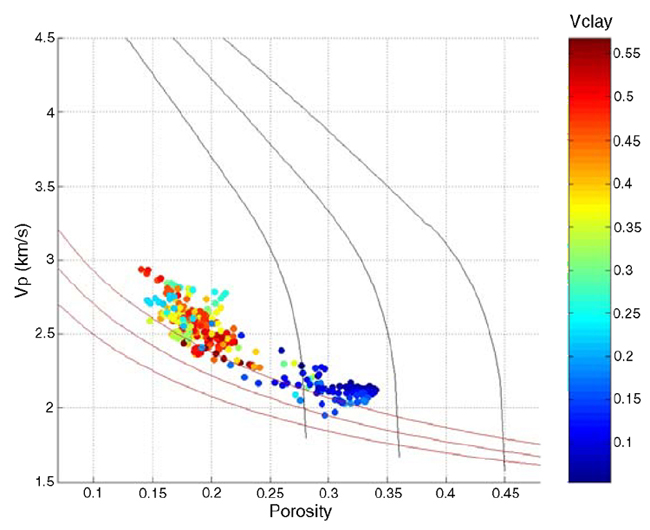
Figure 9: Velocity-Porosity plot for an unconsolidated single fining-upward cycle, corresponding to a fluvial channel fill and the associated floodplain deposits (Figure 7). The theoretical depositional trends (red lines) are obtained from the unconsolidated sandstone model (Mavko et al., 1998). They provide a good approximation to the flat velocity-porosity trend, but they assume a constant proportion of both quartz and clay. The change in clay content shows that the pattern corresponds indeed to a collapsed V, as predicted by the Marion-Yin model.