Print this page
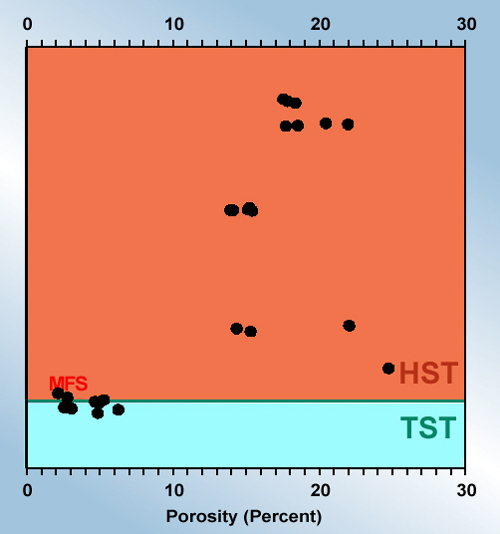
Figure 7.5. Plot of porosity of TST and HST shales, with the former showing lower values. (MFS=maximum flooding surface.)