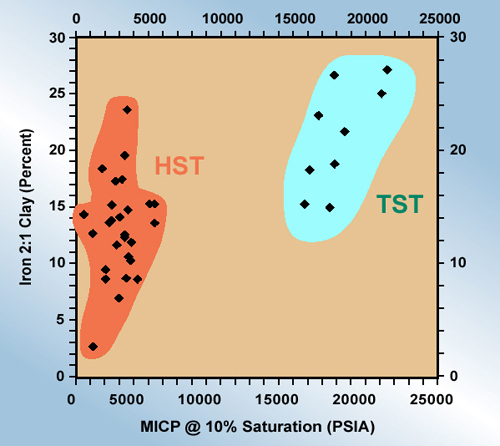
Figure 7.4. Iron 2:1 clay content of TST and HST shales plotted against MICP @ 10% saturation (psia), with the former showing higher values.
Figure 7.4. Iron 2:1 clay content of TST and HST shales plotted against MICP @ 10% saturation (psia), with the former showing higher values.