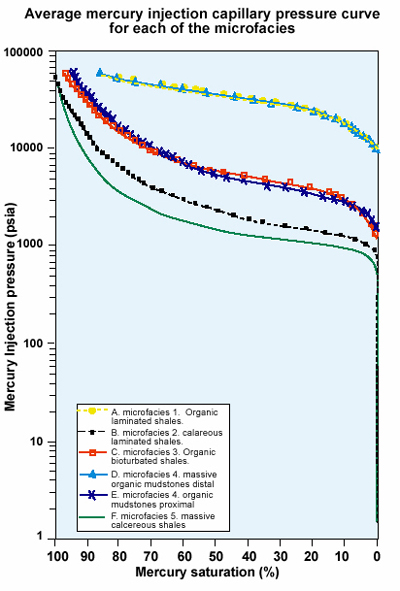
Figure 7.2. Average mercury injection capillary pressure curve for each of the five microfacies of the Lewis Shale, with TST showing the best seal character.
Figure 7.2. Average mercury injection capillary pressure curve for each of the five microfacies of the Lewis Shale, with TST showing the best seal character.