Click on desired area for enlargement.
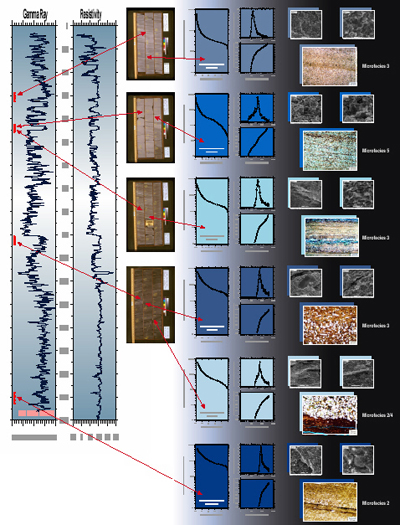
Figure 6.1. Mercury injection capillary pressure curves, pore size distribution, photographs, photomicrographs, and SEM photographs for representative core samples, from the LST part of the Lewis Shale, in Colorado School of Mines Strat Test 61, together with wireline log that shows positions of samples. Samples are from microfacies 2 (moderately to very silty calcareous shales), microfacies 3 (moderately to very silty, mottled, calcareous shales), microfacies 4 (fossiliferous, slightly to moderately silty claystones), and microfacies 5 (very silty shales and mottled argillaceous siltstones).