Click on desired area for enlargement.
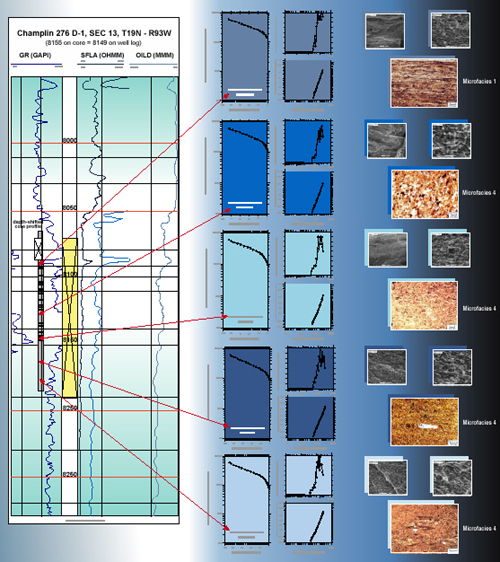
Figure 4.1. Mercury injection capillary pressure curves, pore size distribution, photomicrographs, and SEM photographs for representative core samples, from the TST part of the Lewis Shale, in Champlin 276 D-1, together with section of well log that shows calibrated cored interval and positions of samples. Samples are from microfacies 1 (finely laminated, pyritic, black shales) and microfacies 4 (fossiliferous, slightly to moderately silty claystones).