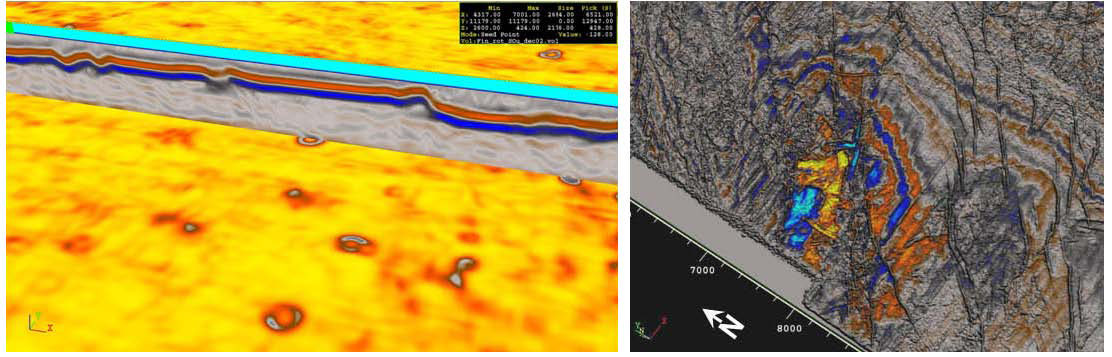
Figure 12. Left: paleopockmarks on top Triassic (base Quaternary). Right: time slice at Triassic level (semblance+amplitude) showing fault-related high amplitudes.
Figure 12. Left: paleopockmarks on top Triassic (base Quaternary). Right: time slice at Triassic level (semblance+amplitude) showing fault-related high amplitudes.