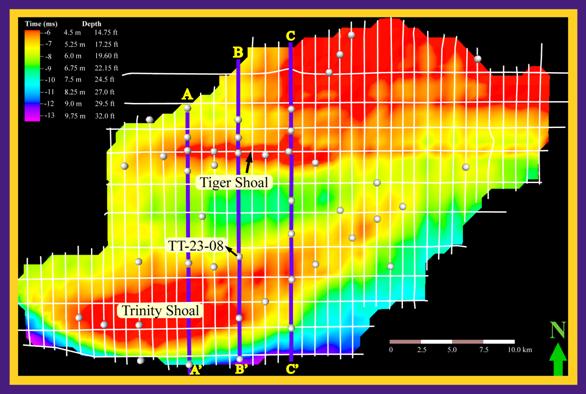
Figure 3. Sea-bottom surface map of the Tiger and Trinity shoals area. Overlying grid represents locations of subbottom proiles gathered, whereas white spheres represent vibracore locations. Subbottom profile lines A-A’, B-B’, and C-C’ shown in Figure 2 are highlighted. 100 km = ~62 mi.