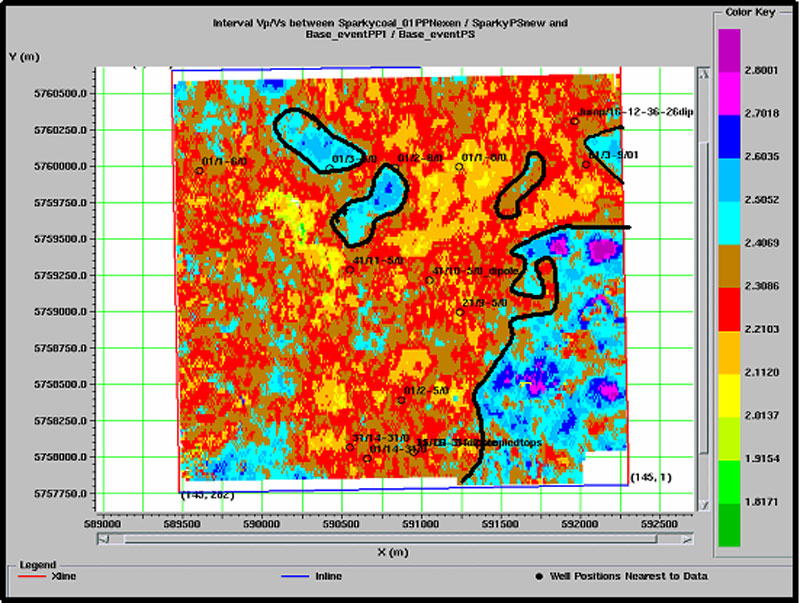
Figure 2. VP/VS map for a 2.75 km by 2.75 km area of the Plover Lake field. Low VP/VS values in the middle of the map correspond to thicker Bakken and Lodgepole, while higher VP/VS on the southeastern side of the map correspond to a zone where the Bakken sand and Lodgepole Formation have both been eroded – suggesting that VP/VS is a good lithology discriminator.