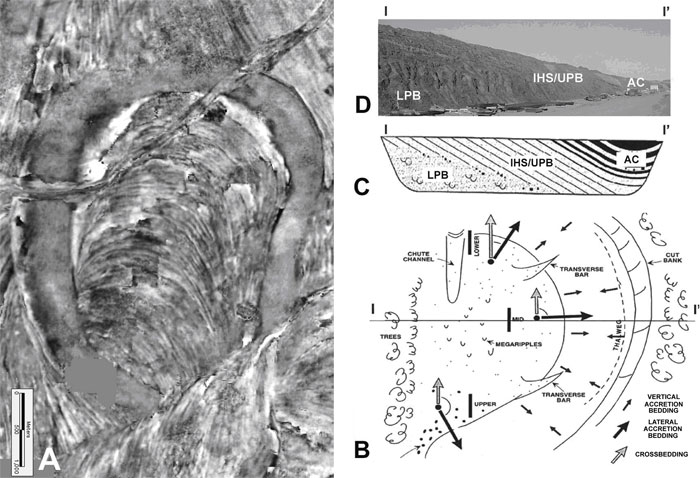
Figure 1. McMurray Formation – geometry and architecture of tidally influenced channel deposits. Figure 1A) seismic time slice from one of NEXEN Inc. /OPTI leases shows the lateral extent of a single point bar deposit extending beyond 4 km. Figure 1B) Dip orientation within a point bar depositional setting: lateral accretion (black arrows) vs. cross-bedding (gray arrows) are juxtaposed on point bar surface. Short gray arrows within the channel suggest the direction of vertical accretion of bedding that would develop after channel abandonment. I-I’ is the position of a cross-sectional line for Figure 1C and D. Modified after Hayes (2002). Figure 1C) Schematic diagram of a point bar deposit illustrating its constituent elements: lower point bar (LPB), upper point bar (UPB) and abandoned channel-fill (AC). The ratio of UPB to LPB increases as the meander migrates until UPB deposit beds extend to the base of the deposit. Modified after Wightman and Pemberton (1997). Figure 1D) Image of an exposure at Muskeg River Mine displaying the lateral and vertical changes of reservoir properties as suggested in Figure 1C. Bitumen grade of 15 mass % encountered in LPB zones decreases laterally (to right) to 0 mass % in abandoned channel-fill deposit (light colored exposure at right end). Length of the exposure is about 500 m., height of the face is 15 m. Modified after Fustic (2007).