![]() Click to view PDF images of illustrations that accompanied oral presentation.
Click to view PDF images of illustrations that accompanied oral presentation.
Reservoir Geology of ERT (Penn Sand) Field
Potter County, Texas: A Case For Cores*
By
Robert W. Von Rhee1
Search and Discovery Article #20010 (2002)
*Adapted as online version from oral presentation to Tulsa Geological Society, October 1, 2002
1Rockford energy Partners, LLC, Tulsa Oklahoma ([email protected])
Abstract
The ERT (Penn Sand) Oil Field was discovered in
1991 by Horizon Oil and Gas. It is located in the northern Palo Duro Basin. By
the end of 1994, seven wells were drilled with a 71% success ratio (5/7). At
this time the field remained incompletely developed with only a southern limit
evident. In 1995 Tide West Oil Company acquired the field based on an estimated
EUR of 1MMBO from producing wells and another 460 MBO recoverable via two proved
undeveloped locations. The Penn Sand ![]() log
log![]() signatures indicated a low-contrast
shaly sand ranging from 70 to 100 feet thick and broken by 1- to 3-foot-thick
beds with little or no porosity. Because of the internal tight beds, the
reservoir was interpreted to be highly heterogeneous and therefore not valued as
a suitable candidate for secondary waterflood recovery. Tide West continued to
develop the field in 1995, drilling eight wells with an 88% success ratio (7/8).
The analysis of whole core taken from two of these wells indicated the reservoir
is a ripple laminated, shaly sandstone turbidite. The cores revealed that the
“tight beds” interpreted from the logs were actually irregularly shaped regions
of cemented sandstone in which nearly all the porosity was occluded by calcite
cementation. The contact between cemented and non-cemented sand was about three
sand grains wide, or less than one millimeter. The contacts cut across
sedimentary structures and bed boundaries and ranged from sub-horizontal to
vertical within the four-inch dimension of the core face. Porosity distribution
was bimodal, clustering from 11 to 16% for uncemented zones and 3 to 6% for the
cemented intervals. The pore system is very fine (pore throats 5-10 micrometers)
yet homogeneous. The sharp transition between porosity regimes resulted in
significant open-hole
signatures indicated a low-contrast
shaly sand ranging from 70 to 100 feet thick and broken by 1- to 3-foot-thick
beds with little or no porosity. Because of the internal tight beds, the
reservoir was interpreted to be highly heterogeneous and therefore not valued as
a suitable candidate for secondary waterflood recovery. Tide West continued to
develop the field in 1995, drilling eight wells with an 88% success ratio (7/8).
The analysis of whole core taken from two of these wells indicated the reservoir
is a ripple laminated, shaly sandstone turbidite. The cores revealed that the
“tight beds” interpreted from the logs were actually irregularly shaped regions
of cemented sandstone in which nearly all the porosity was occluded by calcite
cementation. The contact between cemented and non-cemented sand was about three
sand grains wide, or less than one millimeter. The contacts cut across
sedimentary structures and bed boundaries and ranged from sub-horizontal to
vertical within the four-inch dimension of the core face. Porosity distribution
was bimodal, clustering from 11 to 16% for uncemented zones and 3 to 6% for the
cemented intervals. The pore system is very fine (pore throats 5-10 micrometers)
yet homogeneous. The sharp transition between porosity regimes resulted in
significant open-hole ![]() log
log![]() understatement of porosity thickness and magnitude in
zones less than 1.5 feet thick. Schlumberger’s Formation Micro-Imager tool (FMITM)
successfully resolved the complex contacts between cemented and uncemented
sandstone porosity. The dominance of a single sedimentary process creates a
level of lateral continuity and isotropy. The reservoir is highly heterogeneous
on a small scale, but more laterally and vertically continuous on the inter-well
scale. Because of the core studies, Tide West eventually concluded a waterflood
was feasible. Estimated secondary recovery potential was 3 MMBO, with a 1996
present value of nearly $20 million.
understatement of porosity thickness and magnitude in
zones less than 1.5 feet thick. Schlumberger’s Formation Micro-Imager tool (FMITM)
successfully resolved the complex contacts between cemented and uncemented
sandstone porosity. The dominance of a single sedimentary process creates a
level of lateral continuity and isotropy. The reservoir is highly heterogeneous
on a small scale, but more laterally and vertically continuous on the inter-well
scale. Because of the core studies, Tide West eventually concluded a waterflood
was feasible. Estimated secondary recovery potential was 3 MMBO, with a 1996
present value of nearly $20 million.
|
uDevelopment of ERT field after acquisition
tWell-
uDevelopment of ERT field after acquisition
tWell-
uDevelopment of ERT field after acquisition
tWell-
uDevelopment of ERT field after acquisition
tWell-
uDevelopment of ERT field after acquisition
tWell-
uDevelopment of ERT field after acquisition
tWell-
uDevelopment of ERT field after acquisition
tWell-
uDevelopment of ERT field after acquisition
tWell-
uDevelopment of ERT field after acquisition
tWell-
uDevelopment of ERT field after acquisition
tWell-
uDevelopment of ERT field after acquisition
tWell-
uDevelopment of ERT field after acquisition
tWell-
uDevelopment of ERT field after acquisition
tWell-
uDevelopment of ERT field after acquisition
tWell-
|
Figure Captions (1-17)
Click here for sequence of Figures 12 and 13.
ERT Field
Purchasing an oil field successfully requires that that its size be accurately estimated. Determination of the field size is literally the million-dollar question.
An overview map of the Texas Panhandle, with counties and geologic features, provides the setting of ERT Field (Figure 1). In 1994, Tide West Oil Company had an opportunity to acquire this partly developed oil field. The operator was Horizon Oil &Gas of Spearman, Texas. They had drilled seven wells with one dry hole and one marginal well. They had discovered what they called a “Tonkawa” sandstone reservoir. This field was located south (“on the backside”) of the Amarillo Uplift, on the northern rim of the Palo Duro Basin.
The
By naming it “Penn Sand,” we recognized how little we knew about the reservoir and how little we knew about its producing attributes and ultimate field size potential. This made it “new” and generated much more open-minded thinking about its potential.
At the time we evaluated ERT Field for purchase, it consisted of seven wells (Figure 2) that had been drilled in the following order:
1-2 = Granite wash oil discovery 1-3 = Penn Sand oil discovery 2-3 = T/A-- Penn sand tight 3-3 = Penn Sand oil 2-2 = Penn Sand oil 3-2 = Penn Sand oil 4-2 = Dry hole; Penn Sand absent.
For assessing the size of the field, we organized the geologic research as follows:
• Analyze field size of existing fields Field size vs. discovery date Field size distribution • Map existing data • Synthesize and draw conclusions
Also, a strong sense of urgency was
given to these tasks. Palo Duro Basin references were identified and
studied from personal libraries, Petroleum Abstracts, which was cost
effective, AAPG Library and AGI’s GeoRef, Oklahoma Well Regional Geologic Setting
Understanding the stratigraphic and tectonic settings (Figures 3 and 4) were considered to be fundamental for study of the field. The tectonic framework (after Budnik, 1989) and stratigraphic cross-sections (after Rose, 1986) were important data in this study (Figures 4, 5, 6, and 7). Cross-section M-M’ extends along the basinal part (“throat”) of the Palo Duro Basin between Canyon shelf margins to east and west (Figure 5). There was step-back of Canyon shelf carbonates in the SW Potter County area. The shelf was either drowned or smothered; this may have been the result of an increase of clastic sediments from the uplift to the north in late Canyon (Missourian), early Cisco (Virgilian) time. Dutton’s interpretation (1980) for this area is a substantial Late Pennsylvanian clastic wedge.
ERT Field is in the Whittenburg Trough, north of Bush Dome in the northern part of the Palo Duro Basin (Figure 8). Principal routes of sand transport are from the Amarillo Uplift and secondarily from the Bush Dome and Bravo Dome (Rose, 1986).
In ERT Field, the non-arkosic Penn Sand accumulation is positioned within major transport routes and major accumulation of sediments. Hydrocarbon traps are present in Missourian and Virgilian “wash” on the north side of the Amarillo Uplift. There is potential for distal shale-out and dip reversal against the Bush Dome in SW Potter County.
In Potter County, Texas (Figure 9), with area of 961 sq. mi., about 200 acres of the 22,000-acre lease had been developed when Tide West bid on ERT Field. About a dozen wells had been drilled within the 100 sq. mi. centered on the field. In the county, there were only 53 wells drilled deeper than 4800 feet to penetrate pre-Permian; some of these were deep enough to have encountered the Penn Sand.
Assessing Field Size
In assessing the field size, research was undertaken to (1) analyze the field size of existing fields by plotting field size vs. discovery date and field size distribution, (2) prepare maps from existing data, and (3) synthesize the data and draw conclusions.
To analyze field size of existing fields, the efforts were undertaken to: (1) Calculate Estimated Ultimate Recovery (EUR) of each field/reservoir
(2)
Identify reservoir (3) Identify reservoir age (4) Plot field size vs. discovery date (5) Plot field size distribution and curve
Ultimate recovery of 20 pre-Permian reservoirs in fields in northern Palo Duro Basin, as of the third quarter, 1995, was 14.5 MMBO (Figure 10). Average field size was 725 MBO, with maximum being 4.3 MMBO; median was 86 MBO.
Based on a plot of EUR vs. discovery year, there is no decrease of field size with time (Figure 11). This probably indicates that the basin probably is not fully mature.
For the distribution of pre-Permian field size, a 5th order trend line is close to fitting the data. The trend line shown in Figure 12 is “eyeballed,” based on analysis of the distributions of field sizes in more mature basins. The normal truncation of the “bell curve” for the very small fields is the economic effect of drilling for oil and gas. At some low-end economic point, the “field” turns into a “show” and drops off the chart (Figure 12). Based on this curve and the position of the field on the curve in its undeveloped state, a range of field sizes can be estimated. The most likely Penn Sand field size is estimated to be 1.5-2.5 MMBO (Figure 13); the size of a “one-of-a-kind” field is 3.2-4.75 MMBO.
In cross-section and on an isopach map, the reservoir is shown to thin to the south. We estimated that there were 53 wells in the entire county sufficiently deep to have cut the Penn Sand, with about 12 wells within the 100 sq mi centered on the field. Only about 200 acres of the 22,000 acre lease were developed or explored to this depth in 1995. It was estimated that a porosity pinch-out exists within one location to the south. The operator had stopped field development with its last well (4-2)--a dry hole. Their success rate was 5 out of 7, or 71%. The asset was put-up for sale due to the settlement of a deceased partner’s estate. The operator was a “driller” not a “producer.”
Completion data for the first two wells drilled by Horizon, Bivins Ranch No. 1-2 and Bivins Ranch No. 1-3 (Figure 14), are IPP 105BO/48BW/TSTM (granite wash) and IPP 112BO/0BW/TSTM, respectively. Additional development wells drilled by Horizon are Bivins Ranch No. 2-2, with IPP 116BO/12BW/TSTM, Bivins Ranch No. 3-2, with IPP 122BO/BW16/TSTM (Figure 15), and Bivins Ranch No. 3-3, with IPP281BO/-/TSTM (Figure 16). A stratigraphic cross-section (Figure 17) of the Penn Sand shows the best development to be in Bivins Ranch No. 3-3, which had the highest IPP.
At the time we purchased ERT Field, its EUR was 1 MMBO. Only one side of the field was delimited, and FSD strongly suggested the most likely size would be 1.5 to 2.5 MMBO. Further, the “one-of-a-kind” OOAK (say “oak” effect) was significant, and that helped bolster confidence in the premium paid. Two 230 MBO wells were equated to about 2.8 BCFE with an approximate PV10 of $1.5MM.
We thought that paying for two locations was a good bid, because we had an 80% confidence level that we would drill two, perhaps three times that many wells. Further, two wells would make the field a 1.5 MMBO field, which fit the FSD.
This reasoning and strategy worked. We bought the field for $1.5MM, based on primary development and recovery. The potential for secondary recovery was discounted to zero. Development of ERT Field after Acquisition
Click here for sequence of Figures 25 and 26.
Location of well in Figure 22.
Click here for sequence of Figures 33 and 34.
Click here for sequence of Figures 37 and 38.
Click here for sequence of Figure 49A and 49B.
Click here for sequence of Figures 17 and Figure 50A and 50B.
Well-
|
 Figure 1. Location of ERT Field, Texas
Panhandle, within tectonic framework (after Budnik, 1989).
Figure 1. Location of ERT Field, Texas
Panhandle, within tectonic framework (after Budnik, 1989). Figure 2. ERT Field, as of 1994, with
seven wells, including one dry hole and one marginal well (2-3).
Figure 2. ERT Field, as of 1994, with
seven wells, including one dry hole and one marginal well (2-3). Figure 3. Type
  Figure 4. Tectonic framework, Texas
Panhandle, with location of ERT Field and north-south stratigraphic
cross-section (M-M’)
Figure 4. Tectonic framework, Texas
Panhandle, with location of ERT Field and north-south stratigraphic
cross-section (M-M’) Figure 6. Tectonic framework, Texas
Panhandle, with location of ERT Field and west-east stratigraphic
cross-section (U-U’)
Figure 6. Tectonic framework, Texas
Panhandle, with location of ERT Field and west-east stratigraphic
cross-section (U-U’) Figure 9. Map of Potter County, Texas,
with area of 961 sq. mi., showing location of ERT Field.
Figure 9. Map of Potter County, Texas,
with area of 961 sq. mi., showing location of ERT Field. Figure 16. Penn Sand porosity
  Figure 20. Porosity
  Figure 22. ERT Field, showing 1995
development wells, including two cored wells (Bivins Ranch No. 4-3 and
Bivins Ranch No. 6-2).
Figure 22. ERT Field, showing 1995
development wells, including two cored wells (Bivins Ranch No. 4-3 and
Bivins Ranch No. 6-2). Figure 23. Well
  Figure 25. Brown oil-stained sandstone
with irregularly distributed gray, calcite-cemented sandstone, Bivins Ranch No. 4-3, 5200-5210 feet.
Figure 25. Brown oil-stained sandstone
with irregularly distributed gray, calcite-cemented sandstone, Bivins Ranch No. 4-3, 5200-5210 feet.
 Figure 28. Shaly,
porous sandstone, with
ripple-lamination, Bivins Ranch No. 4-3, 5212
feet.
Figure 28. Shaly,
porous sandstone, with
ripple-lamination, Bivins Ranch No. 4-3, 5212
feet. Figure 31. Well
  Figure 33. Brown oil-stained sandstone
(in ordinary light), with patches of gray, calcite-cemented sandstone Bivins Ranch No. 6-2,
5586-5596 feet.
Figure 33. Brown oil-stained sandstone
(in ordinary light), with patches of gray, calcite-cemented sandstone Bivins Ranch No. 6-2,
5586-5596 feet. Figure 34. Same cored interval in Bivins
Ranch No. 6-2 as presented in
Figure 34. Same cored interval in Bivins
Ranch No. 6-2 as presented in Figure 36. Sandy shale, interpreted as
turbidite, in Bivins Ranch No. 6-2, 5626-5636 feet, with oil-stained
(but tight) sand ripples (yellow) (in ultraviolet light).
Figure 36. Sandy shale, interpreted as
turbidite, in Bivins Ranch No. 6-2, 5626-5636 feet, with oil-stained
(but tight) sand ripples (yellow) (in ultraviolet light). Figure 37. Highly cemented shaly
sandstone (arrowed) vs. shaly sandstone with 12% porosity, Bivins Ranch
No. 4-3. Note sharp gray-brown color contrast that cuts across bed
boundaries.
Figure 37. Highly cemented shaly
sandstone (arrowed) vs. shaly sandstone with 12% porosity, Bivins Ranch
No. 4-3. Note sharp gray-brown color contrast that cuts across bed
boundaries.
 Figure 42. Core interval in Bivins Ranch
No. 6-2 (5586-5596 feet) (in ultraviolet light), along with interval of FMI
Figure 42. Core interval in Bivins Ranch
No. 6-2 (5586-5596 feet) (in ultraviolet light), along with interval of FMI  Figure 44. Porosity distribution shows
distinct bimodality (3.5-6.5% and 11.5-16.5%).
Figure 44. Porosity distribution shows
distinct bimodality (3.5-6.5% and 11.5-16.5%). Figure 45. Porosity vs. permeability,
showing bimodality of these parameters, cluster of which for the pay
zone is 11-16% porosity and 0.3-10 md.
Figure 45. Porosity vs. permeability,
showing bimodality of these parameters, cluster of which for the pay
zone is 11-16% porosity and 0.3-10 md. Figure 46. Grain density vs. core
porosity, Bivins Ranch No. 6-2, showing a sample grouping due to calcite
cement.
Figure 46. Grain density vs. core
porosity, Bivins Ranch No. 6-2, showing a sample grouping due to calcite
cement. Figure 47. Core-
 Figure 48. Core-
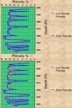 Figure 49. A. Core-
 Figure 51. Map of ERT Field showing 1995
and post-1995 development.
Figure 51. Map of ERT Field showing 1995
and post-1995 development. 