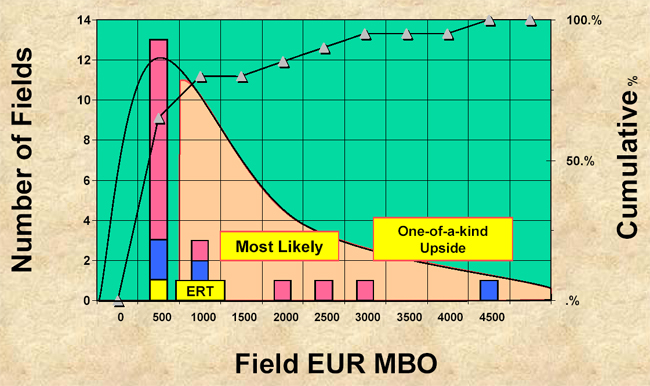
Figure 13. Graph of pre-Permian field size distribution, showing most likely size and size of “one-of-a-kind” field. The shaded area indicates a rough estimate of the remaining potential for the Pre-Permian fields in the basin.
Click here for sequence of Figures 12 and 13.