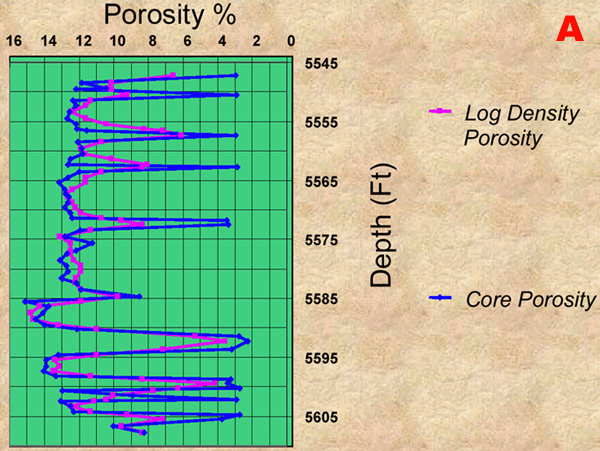
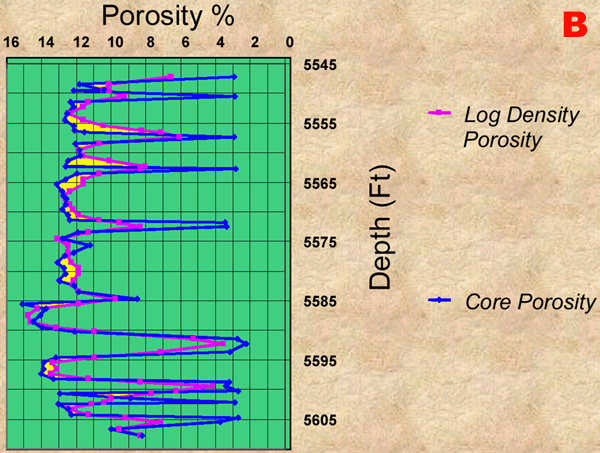
Figure 49. A. Core-log porosity plot, showing that log porosity in the porous sandstone is lower than core porosity. B. Core-log porosity plot, with differences in porosity determinations, where log porosity is less than core porosity, shown in yellow.