A NEW TECHNIQUE FOR 3-D FLEXURAL-SLIP RESTORATION*
By
Paul A. Griffiths1, Serena Jones1, Neil Salter1, Frauke Schaefer1, Robert Osfield1 and Herbert Reiser2
Search and Discovery Article # 40038 (2002)
*Adapted for online presentation from poster session presented at AAPG Annual Meeting, Denver, CO, June, 2001.
1Midland Valley Exploration Ltd., 14 Park Circus, Glasgow, G3 6AX, UK. ([email protected]) (www.mve.com)
2BEB Erdgas und Erdoel Gmbh, Riethorst 12, D-30659 Hannover, Germany.
Editorial Note: This article, which is highly graphic (or visual) in design, is presented as: (1) five posters, with (a) each represented in JPG by a small, low-resolution image map of the original; each illustration or section of text on each poster is accessible for viewing at screen scale (higher resolution) by locating the cursor over the part of interest before clicking; and (b) each represented by a PDF image, which contains the usual enlargement capabilities; and (2) searchable HTML text with figure captions linked to corresponding illustrations with descriptions.
Users without high-speed internet access to this article may experience significant delay in downloading some of these illustrations due to their sizes
First Poster
Second Poster
Third Poster
Fourth Poster
Fifth Poster
A new flexural-slip structural restoration technique for three-dimensional (3-D) digital models has been developed. This technique utilises a slip method that preserves volume in 3-D, line length in a given unfolding direction (of a specified surface and of layers parallel to this surface), and orthogonal bed thickness. These constraints enable the restoration of 3-D fault-propagation, fault-bend and detachment folds.
The
3-D model is comprised of objects such as interpreted horizon and/or fault
surfaces that are created from irregular, triangulated meshes. For a given
model, a parallel sinuous-slip ![]() system
system![]() is calculated from the geometry of a
specified template surface and from a fixed pin surface that passes through all
vertices of the triangulated meshes in the specified folding direction. The
entire slip
is calculated from the geometry of a
specified template surface and from a fixed pin surface that passes through all
vertices of the triangulated meshes in the specified folding direction. The
entire slip ![]() system
system![]() then is folded to a new shape, which is defined by a
geometric surface that can be curved or planar. In doing so, all vertices within
the
then is folded to a new shape, which is defined by a
geometric surface that can be curved or planar. In doing so, all vertices within
the ![]() system
system![]() are transformed to their new locations to generate a newly folded 3-D
model.
are transformed to their new locations to generate a newly folded 3-D
model.
We
demonstrate the 3-D restoration technique by ![]() using
using![]() a case study of an evaporite-cored
contractional fold in the NW German Basin. Our restorations depict the 3-D
sequential growth of the fold from 146 Ma through late Mesozoic, and show that
the shortening direction was towards NNE with the main contractional phase
initiating during the Late Cretaceous.
a case study of an evaporite-cored
contractional fold in the NW German Basin. Our restorations depict the 3-D
sequential growth of the fold from 146 Ma through late Mesozoic, and show that
the shortening direction was towards NNE with the main contractional phase
initiating during the Late Cretaceous.
|
|
Figure Captions (in abbreviated form)**
Click here for sequence of sections.
Click here for sequence of maps.
**Complete caption appears with each full-sized image and after References.
A number of techniques have successfully been applied to cross-section and surface restoration of contractional folds (e. g., Geiser et al., 1988; Williams et al., 1997; Hennings et al., 2000). These techniques have been used to study detailed contractional fold geometries and their associated strains. While insightful, these methods require that cross sections be treated independently or that structural surfaces be unfolded separately. We
describe a new 3-D flexural-slip restoration algorithm, which allows the
restoration of multiple, geometrically complex, and non-parallel
surfaces within a 3-D digital model in a single modelling increment.
This plane-strain algorithm also preserves the connectivity of parallel
or non-parallel surfaces To illustrate the method we restored and analysed a folded structure in the NW German Basin. Due to the 3-D nature of the algorithm, the unfolding direction becomes an important parameter that affects the results of our case study. For this reason, an approach for defining the optimum unfolding direction is also described. The 3-D Flexural Unfolding Technique The folding technique utilises a digital geological model that consists of 3-D surfaces, which may represent any geological surface (e.g., faults and/or stratigraphic horizons). These surfaces are composed of sets of data points that are connected to form arrays of regular or irregular triangles. The data structure of the digital model uniquely identifies each node and retains its connection information to other nodes in the surface. This information allows the triangle connectivity to remain the same before and after folding. In
addition to triangulated surfaces, the model may also include 3-D
polylines that are composed of connected line segments, and arrays of
nodes connected to form volumes that are represented as tetrahedral
elements. Although we describe our algorithm The
folding technique is based on the transformation of a flexural-slip
1.
The template surface, which is a triangulated mesh, may be a folded
(including overturned geometries) or planar surface. The geometry of the
template surface defines the initial slip 2.
The target surface, which is either a triangulated mesh or a
mathematical plane, may be a folded (including overturned geometries) or
a planar surface. The geometry of the target surface defines the final
geometry of the slip 3. The pin surface, which is either a triangulated mesh or a mathematical plane, may be a geometrically complex or planar surface. The pin surface defines the surface of zero slip during the folding process. Nodes of geological surfaces that intersect this pin surface will not slip during folding. However, a node on the pin surface pre-folding may be translated to another location on the pin surface post-folding. 4.
The unfolding plane is a vertical mathematical plane. Nodes are
displaced parallel to the unfolding plane as they move along the slip
In
addition to the template surface, other objects may be deformed during
the folding process (these objects are called passive objects). Passive
objects may be any node-based geometric objects. They are folded on a
per-node basis parallel to the defined slip We
calculate the initial slip The folding algorithm preserves several aspects of the 3-D model:
These constraints are maintained whether there is constant or variable shortening along the strike of a fold. Once
the slip The
node positions are defined by the sth local s:
The distance from the node to the pin surface as measured along the
node’s slip t:
The orthogonal distance of the node from an arbitrary, fixed position
vertical unfolding plane (i.e., in and out of the page in Figure
2). The t
value forms a relative 3-D h: The orthogonal distance of the node from the template surface. This distance is defined by the intersection of the template surface and the unfolding plane at the location of a node (Figure 2). All nodes are located within a dip domain as dip-domain boundaries are defined as being infinitely thin. This
sth value for the node defines where the final folded position of
the node lies within the target slip Benefits of the restoration technique The key difference between this technique and previous flexural unfolding methodologies is that object restoration is performed on a per-node basis while maintaining the node connectivity during the folding process. Previous
techniques Because
the technique does not require triangle fitting, strains that are
generated during the restoration process can be analysed in a geological
context. Our technique also provides advantages over previous inversion
schemes for searching for an optimal transformation from one folded state
to another (e.g., Leger et al., 1997). Specifically, the calculated slip
1. line length in the orientation of the unfolding plane of the template surface; 2.
thickness orthogonal to the slip 3. line length in the unfolding direction of surfaces parallel to the template surface; and 4. volume of the folded objects. Our restoration technique has been applied to a contractional fold in the NW German Basin. The structure is located near the northern margin of the Jurassic to Early Cretaceous Lower Saxony Basin, which was inverted during Late Cretaceous (Baldschuhn et al., 1991, Kockel et al., 1994; Figure 3a). Inversion is manifested by thrusting and thrust-related folding through the reactivation of former basin-bounding normal faults and by exploiting Permo-Triassic halite layers as detachment horizons. The model used for this study was built from a depth-converted, 3-D seismic interpretation of the structure, based on unpublished hydrocarbon exploration data. The model is approximately 6km by 6km in map extent, and 3km in depth. It contains eight surfaces that represent interpreted seismic horizons of different geological surfaces. From oldest to youngest they are: the Base Roet; Top Roet; Top Muschelkalk; Base Cretaceous; Near Base Cretaceous; Top Santonian; Top Campanian; and Base Tertiary (Figure 3). The actual structure is an asymmetric, thrust-cored fold with thickness variations within most of the stratigraphic layers involved (Figure 3). At the base of the interpretation, the Lower Triassic Base Roet surface dips slightly to the north; elsewhere the Triassic Roet evaporite layer is folded along and is offset by a thrust fault (which strikes ESE-WNW parallel to the overlying folds). The overlying Triassic-age Keuper layer is folded and shows thinning to the south (Figure 3a). Lower Cretaceous strata also display thickness changes, but with thinning to the north. Above the Lower Cretaceous layer, the Upper Cretaceous units are all folded with thickness changes across the fold axis, whereas the overlying Tertiary is regionally dipping to the north and is not folded. The lowermost folded, but unfaulted, horizon is the Top Muschelkalk surface; it has a structural relief of over 600m (Figure 3b). The surface is deformed into an anticline with an E-W doubly plunging axial trace that trends towards 098o. The object of the restoration was to examine the temporal evolution of the fold. We
first sequentially decompacted the 3-D surfaces and then unfolded them to
a horizontal datum At each restoration stage, the uppermost stratigraphic surface was unfolded to the datum whilst the underlying surfaces were carried as passive objects. Horizons
below the Top Muschelkalk have not been restored as it seemed
inappropriate to restore faulted layers that involved evaporites Sensitivity Testing of Unfolding Direction for 3-D Restoration Two
analyses were carried out The first analysis was to test the sensitivity of total surface area change with variation of the unfolding plane orientation. It was assumed that the most appropriate unfolding plane orientation will result in the minimum surface area change. The pin surface orientation of 090o (E-W) was maintained, whilst the unfolding plane orientation was varied (Figure 4b). The second analysis tested the sensitivity of the total surface area change to the pin surface orientation. The pin surface was kept orthogonal to the unfolding plane as the unfolding plane orientation was varied (Figure 4c). The
difference in percentage area change of the surface by The conclusion is that the unfolding process is not sensitive to the pin surface orientation (Figures 4b and c). The optimal unfolding direction based on minimising the surface area change was determined to be 189o. This orientation has been used throughout all the restoration stages. In addition, the pin surface orientation was kept at a constant 090o (E-W) orientation for all restorations. The restoration results are presented from present-day to the earliest Cretaceous, which is the order of the restoration sequence (Figures 5 and 6). The geological interpretation has been restored through six unfolding stages (Figures 5 and 6). The section illustrated in Figure 5 is representative of the evolution of the structure through time parallel to the maximum shortening direction (189o). Decompaction at each restoration stage has produced an increase in volume (and hence cross-sectional area) of the structure as layers were backstripped (Figure 5). By comparing the present-day palinspastic maps and cross sections with their latest Cretaceous counterparts, the structural-relief contours at Top Muschelkalk level are very similar (Figures 5a, 5b, 6a and 6b). The interpretation of the similarity of the maps is that during Tertiary, there was very little growth of the folds (Figure 5g). However, regional tilting to the north did occur during this time. The restorations to latest Cretaceous (Maastrichtian and Campanian deposition) show the progressive growth in amplitude of the anticline and flanking synclines, coupled with continued shortening (Figures 5b, 5c, 6b and 6c). In particular, the anticline grew in amplitude and broadened in the east. The growth of the fold is represented by thickness changes in the Maastrichtian and Campanian layers. The latest Santonian restoration (83 Ma) suggests at Top Muschelkalk level the initiation of the fault-propagation fold (Figures 5d and 6d). The regional dip of the Top Muschelkalk surface during Santonian was towards the ESE. The majority shortening that produced the fault-propagation fold occurred during this time, as can be observed from the plot of cumulative shortening versus geological age (Figure 5g). The restoration to Early Cretaceous time (97 Ma) shows the regional dip of the Top Muschelkalk surface remained towards the ESE. The Lower Cretaceous rocks also thicken in this direction. Minor WNW-trending folds also remain present in the Muschelkalk surface as well (Figures 5e and 6e). The restoration representing earliest Cretaceous time (146 Ma) shows the Top Muschelkalk surface with a change in the regional dip to the NE (Figure 5f and 6f) and with the Keuper unit thickening to the NE (Figure 5f). In addition to the regional dip, the Top Muschelkalk surface is also deformed by two minor, broad folds that trend between WNW and NW. In the final restoration in the sequence (not shown), the Top Muschelkalk surface was flexurally unfolded to a horizontal target surface to act as a reference for the shortening and area-based strain analyses. The loose lines for the cross sections that have been extracted from the 3-D model at each restoration stage show very little deformation (Figure 5). The map-view loose lines along the southern margin of the Top Muschelkalk surface at each restoration stage provide more information about the variability of horizontal shortening across the area (Figure 7). The unfolding direction and the shortening measurement are oblique to the 3-D model boundaries, which reduces the amount of apparent shortening in the SE and NW corners of the model (Figure 7a) because the anticline is not intersected in the unfolding direction (Figure 7b at approximately 6300m along the E-W axis). The map loose lines show a general apparent increase in shortening from east to west from approximately 250m to 590m (Figures 7a and b). This increase is a minimum shortening, as some of the minor folds are not represented across the whole model. Taking the coverage into account, the local variability in shortening reflects real changes in fold geometry that might be produced by displacement or geometry changes along strike of the fault. These anomalies of the map-view loose line may represent zones of increased local deformation or may highlight areas where the interpretation requires adjustment. In either case, these regions are more easily recognised and adjusted with 3-D restorations in contrast to 2-D restorations. The change in surface area of the Top Muschelkalk surface has been determined at each restoration stage (Figure 7c). The actual surface area of the Top Muschelkalk surface is interpreted to have decreased from the Mid-Triassic to the present-day based on the restorations, with the greatest magnitude of change occurring during the Cretaceous. Hennings et al. (2000) noted that surface-area changes produced by plane-strain flexural slip unfolding of a surface represent the deviation of the fold shape from a constant-amplitude, cylindrical fold. In this study, the area change of the Top Muschelkalk is a product of: 1. the non-cylindrical nature of the structure 2. the compaction of the sedimentary sequence through time 3. the non-parallel geometry of the layers Area
strains generated by The restorations bracket the contractional phase of the structure to the Late Cretaceous, with only minor regional tilting during other stages. The rate of shortening sharply increased from the Late Triassic and Early Cretaceous regional tilting to the active thrusting and folding of the Late Cretaceous (Figure 5g). The amount of contraction decreased during the Maastrichtian and did not continue into the Tertiary. Other studies across the entire NW German Basin show abundant evidence that the contraction phase started no earlier than the onset of the Late Cretaceous Coniacian stage (88ma according to Harland et al., 1989), and lasted through the Coniacian-Santonian and partly into the Campanian and Maastrichtian (Baldschuhn et al., 1991, and references therein). Our analyses do not have enough resolution to establish precisely the onset of the contractional phase. Even so, application of this new restoration technique to this structure has produced results that are in agreement with the regional geohistory already established. A new, robust technique for 3-D restoration of flexural-slip folds has been presented. This plane-strain technique preserves: 1. volume between folded layers 2. orthogonal thickness of layers 3. line length in the unfolding direction of layers parallel to the template surface 4. maintains the folded object topology. An important advantage of this algorithm over previously published techniques is that restoration of multiple, geometrically complex, and non-parallel surfaces is possible in a single modelling increment. A
3-D model of a salt-cored, fault-propagation fold has been sequentially
restored Conclusions from the analyses: 1. The shortening direction for the fold was approximately N-S (189o). 2. The fold initiated during Late Cretaceous. 3. Shortening and fold amplification ceased by Tertiary. 4. Timing of fold development (and by inference the initiation of regional compression during the Late Cretaceous) determined from the restorations agrees with published interpretation for the initiation of shortening in NW Germany. 5. Map-view loose lines from the 3-D restorations identify geometric problem areas in the model or regions that have experienced more intense deformation. Allen, P. A., and Allen J. R., 1990. Basin Analysis, Principles and Applications. Blackwell Science, Oxford. Baldschuhn, R., Best, G., and Kockel, F., 1991. Inversion tectonics in the northwest German basin. In: Spencer, A. M. (Eds.), Generation, accumulation, and production of Europe’s hydrocarbons. Special Publication of the European Association of Petroleum Geologists 1, pp. 149.159. Geiser, J., Geiser, P. A., Kligfield, R., Ratliff, R., and Rowan, M., 1988. New applications of computer-based section construction: strain analysis, local balancing, and subsurface fault prediction. The Mountain Geologist 25, 47.59. Gratier, J. .P., Guillier, B., Delorme, A., and Odonne, F., 1991. Restoration and balance of a folded and faulted surface by best-fitting of finite elements: principle and applications. Journal of Structural Geology 13, 111-115. Gratier,
J. .P., and Guillier, B., 1993. Compatibility constraints on folded and
faulted strata and calculation of total displacement Harland, W. B., Armstrong, R. L., Cox, A. V., Craig, L. E., Smith, A. G., and Smith, D. G., 1989. A geologic time scale. Cambridge University Press. Hennings, P. H., Olson, J. E., and Thompson, L. B., 2000. Combining outcrop data and three-dimensional structural models to characterize fractured reservoirs: an example from Wyoming. AAPG Bulletin 84, 830-849. Kockel,
F., Wehner, H., and Gerling, P., 1994. Petroleum systems of the Lower
Saxony Basin, Germany. In: Magoon, L. B., and Dow, W. G. (Eds.), The
petroleum Leger, M., Thibaut, M., Gratier, J. .P., and Morvan, J. .M., 1997. A least-squares method for multisurface unfolding. Journal of Structural Geology 19, 735-743. Ramsay, J. G., and Huber, M., 1987. The Techniques of Modern Structural Geology. Volume 2: Folds and Fractures. Academic Press, London. Rouby,
D., Xiao, H., and Suppe, J., 2000. 3-D restoration of complexly folded and
faulted surfaces Williams, G. D., Kane, S. J., Buddin, T. S., and Richards, A. J., 1997. Restoration and balance of complex folded and faulted rock volumes: flexural flattening, jigsaw fitting and decompaction in three dimensions. Tectonophysics 273, 203-218.
The
authors would like to thank BEB and Exxon/Mobil for access to, and
permission to, use the 3-D geological model of the German fold. The
modelling environment and the implementation of the algorithm have been
carried out |
 Figure
1. Components of the flexural-slip folding technique.
Figure
1. Components of the flexural-slip folding technique. Figure
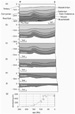
3. Present-day geometry of the contractional fault-related fold from the
NW German Basin. (a) Cross section. (b) Structural relief map on Top
Muschelkalk.
Figure
3. Present-day geometry of the contractional fault-related fold from the
NW German Basin. (a) Cross section. (b) Structural relief map on Top
Muschelkalk.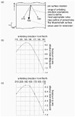
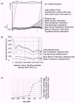 Figure
7. Analyses of the shortening and area strain at Top Muschelkalk level
based on sequential restorations.
Figure
7. Analyses of the shortening and area strain at Top Muschelkalk level
based on sequential restorations.