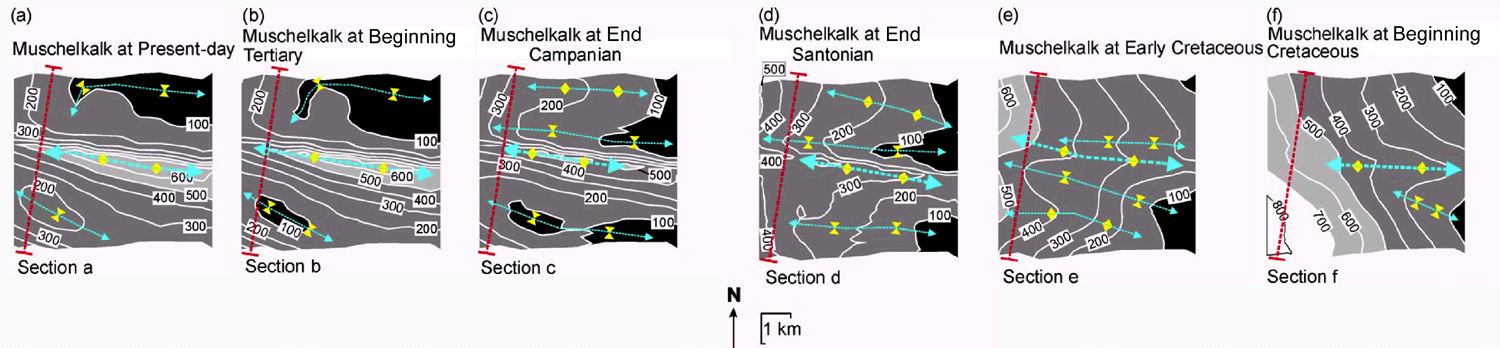
Figure 6. Structural-relief maps of the Top Muschelkalk surface at each stage of the 3-D restoration. Contours are relative to the lowest point on each horizon to show the comparative size of the folds through geological time. The darker shades show the lowest areas on each surface, whereas the lighter shades are the highest regions. Contour interval is 100m. Cross-section locations refer to the palinspastic sections in Figure 5. Arrows are used to highlight the fold axes, including the relatively minor features.