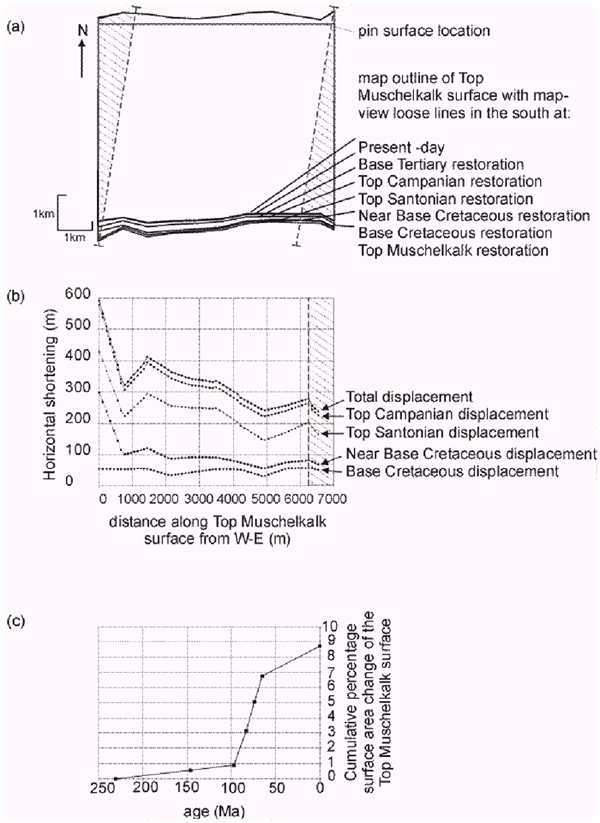
Figure 7. Analyses of the shortening and area strain at Top Muschelkalk level based on sequential restorations. (a) Map of the outlines of the Top Muschelkalk surface at each restoration stage. The southern margin of each surface represents the loose line from each restoration. (b) Plot of horizontal shortening versus distance along the Top Muschelkalk surface from west to east. Lines on the plot show the variation in shortening at Top Muschelkalk level at each stage of the restoration. (c) Plot of cumulative percentage area change for the Top Muschelkalk surface versus geological age. The plot illustrates the accumulation of strain from the undeformed to the present-day shape of the Top Muschelkalk surface.