Click to view the posters in PDF
PSSeal Character and Variability Within Deep-Marine Depositional Systems: Seal Quantification and Prediction
By
William R. Almon1 and William C. Dawson1
Search and Discovery Article #40125 (2004)
*Adapted from poster presentation at AAPG Annual Meeting, Dallas, Texas, April 18-21, 2004. closely related poster/article, prepared and presented by the authors and S.J. Johansen, is entitled “Seal and Reservoir Characterization of Upper Slope Fan Lithofacies:Example of High-Frequency Variability,” (Search and Discovery Article #40124).
1ChevronTexaco, Bellaire, TX ([email protected]; [email protected])
Abstract
Seals are a key element of petroleum systems, yet they have received limited systematic study. Textural and compositional variations permit the recognition of six shale lithofacies in Tertiary, deep-marine, depositional settings. Each shale type end-member has distinctive textures and fabrics, which record variations in depositional conditions. Textural and compositional variations of shales, considered within the context of sequence stratigraphy, provide a basis for seal risk assessment. As determined from mercury injection capillary pressure (MICP) analysis, the pressure required to attain critical seal pressure (10% non-wetting saturation) varies over a considerable range (15 to 20,000 psia). Tertiary shales from offshore Brazil have consistently low critical seal pressures relative to age-equivalent shales from offshore West Africa. Tertiary shales from wells in the Gulf of Mexico have intermediate MICP values (mean: 4,700 psia). The organization of shale facies within a sequence stratigraphic framework reveals systematic variations in seal character. Silt-poor shales from uppermost transgressive systems tracts, and some condensed shales, have good to excellent seal potential. In contrast, silt-rich shales from highstand and lowstand systems tracts have moderate to low sealing capacities. Seal quality generally increases as total clay and carbonate content increase; other compositional variables have limited predictive relationship with seal character. Likewise, log-derived parameters lack significant potential to accurately predict critical nonwetting saturation values. Additional seal variability factors include changes in the rate of deposition, early marine cementation, and depositional fabric. Available data provide a compelling argument for textural control of seal character induced by high-frequency stratigraphic cycles.
|
uAbstractuClay composition & log analysis
uAbstractuClay composition & log analysis
uAbstractuClay composition & log analysis
uAbstractuClay composition & log analysis
uAbstractuClay composition & log analysis
uAbstractuClay composition & log analysis
uAbstractuClay composition & log analysis
uAbstractuClay composition & log analysis
|
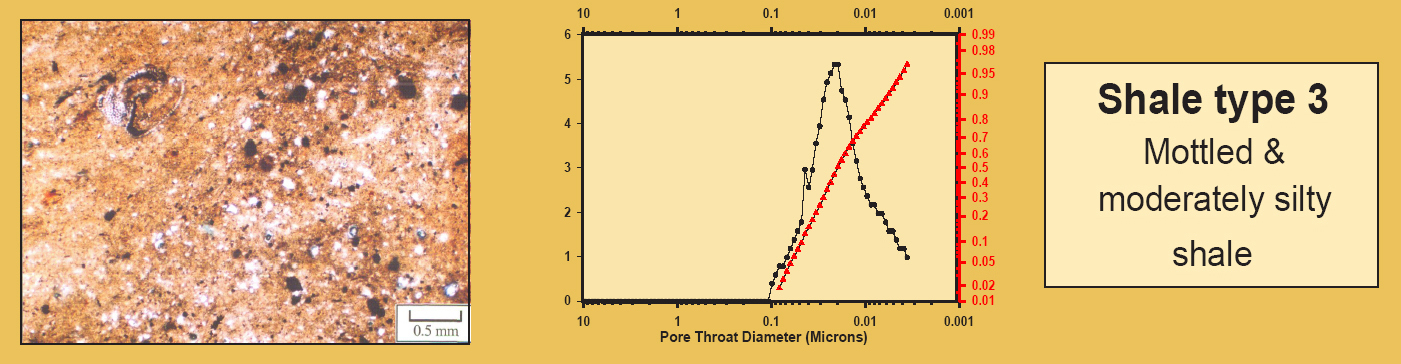
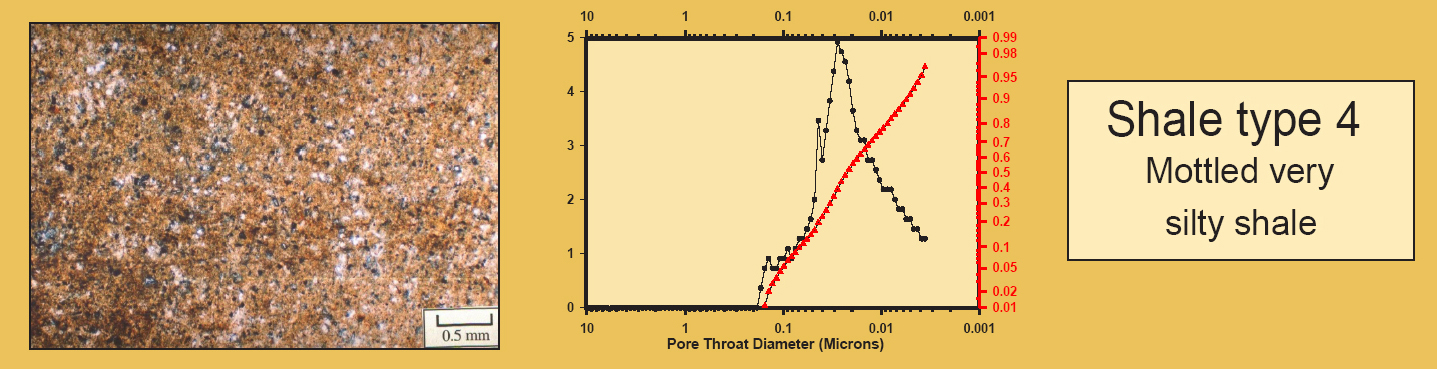
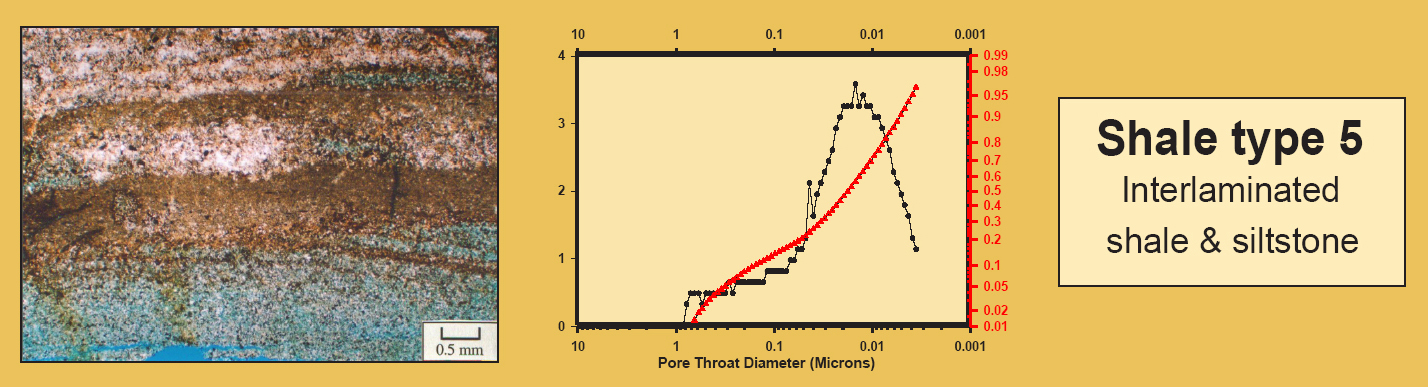
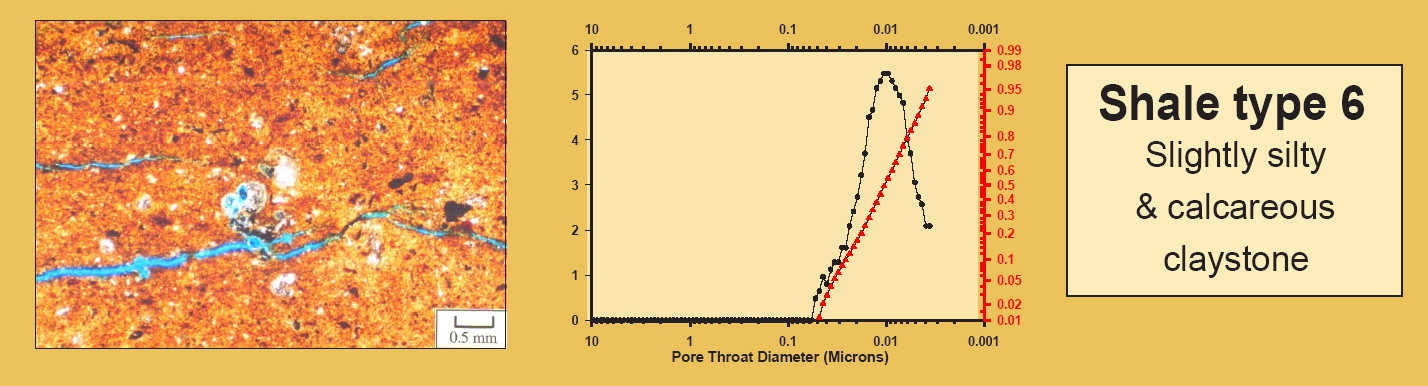
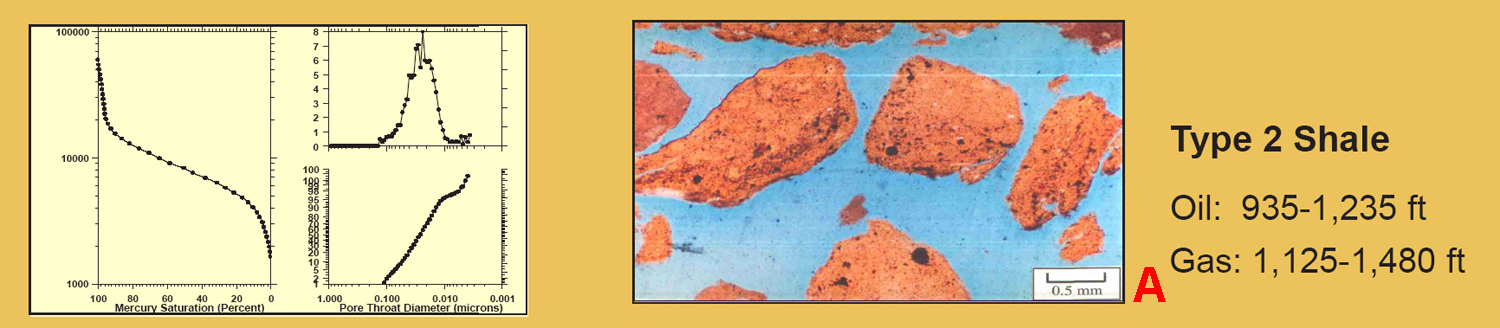
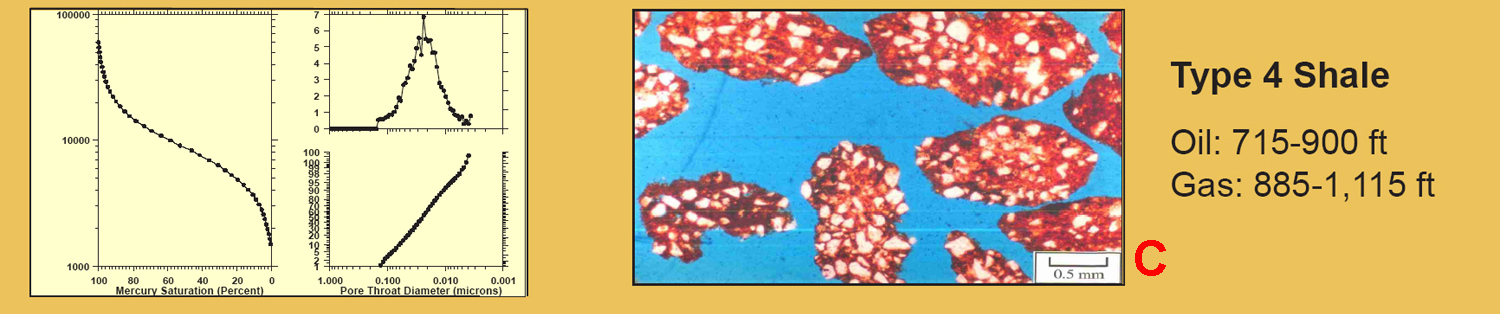
Introduction(Figures 1,2-1, 1,2-2, 1,2-3, and 1,2-4)
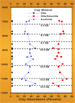
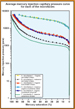
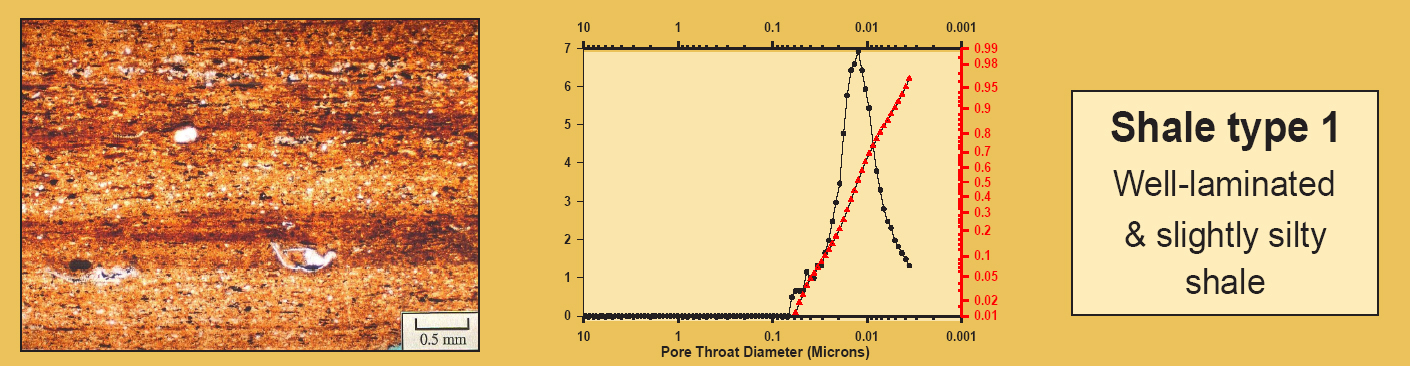
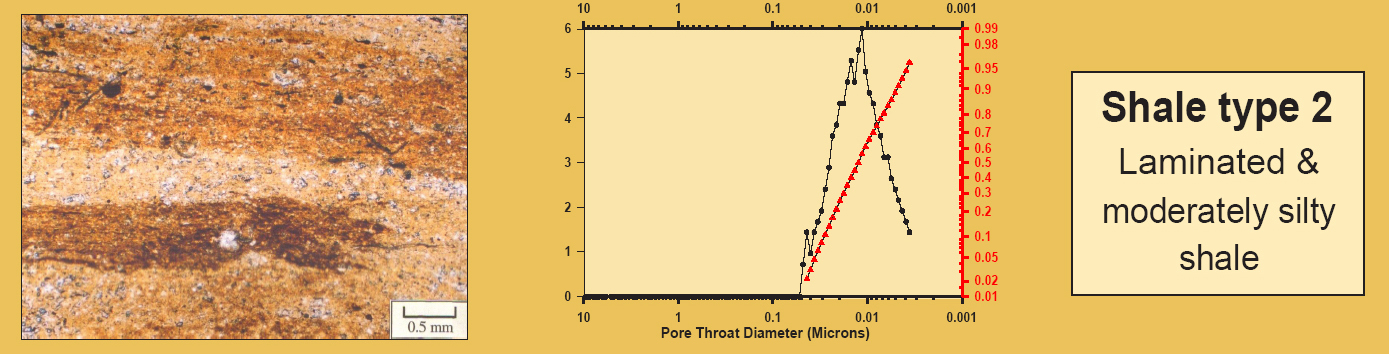
Analyses of Tertiary-aged shales from deepwater depositional settings (e.g., offshore West Africa, Brazil, and Gulf of Mexico) reveal the common occurrence of six shale end-member types (shale microfacies). Each shale microfacies has distinctive textures and fabrics, which represent variations in depositional conditions. Additionally, systematic patterns of seal character are evident where these shale types are organized within a sequence stratigraphic context. In general, silt-poor shale types 1 and 2 (representing upper transgressive units) and some condensed intervals (shale type 6) offer good to excellent seal potential. In contrast, silt-rich highstand shales (types 3 and 4) and lowstand shales (type 5) have relatively low sealing capacities. Increased percentages of detrital silt grains reduce sealing capacity by inhibiting mechanical compaction, thereby allowing the preservation of relatively large-diameter pore throats. Seal potential is quantified using mercury-injection capillary pressure (MICP) analysis (Berg, 1955; Showalter, 1977; Jennings, 1987; Watts, 1987). Shale facies are defined petrographically and interpreted sedimentologically on the basis of fabric and texture (e.g., Schieber, 1999; Dawson, 2000). The content of detrital silt appears to influence the effectiveness of mechanical compaction processes (Krushin, 1997), shale permeability (Dewhurst et al., 1999), and ultimately, sealing capacity (Almon et al., 2002; Dawson et al., 2003). The shale samples, MICP of which are illustrated in Figure 1,2-2, have very good to excellent membrane seals. Shapes of injection profile curves indicate that there are three pore structure families in this data set, which can be related to total clay content and shale fabric. Samples are color-coded by shale type. Type 2 shales (red) have a mean critical injection pressure of 6938 psia. Type 3 shales (red) have a mean critical value of 6809 psia. Type 6 shales (red) exhibit a mean critical injection pressure of 11,027 psia indicating exceptional seal potential, assuming the absence of open microfractures.
Clay Composition and Log Analysis(Figures 3-1, 3-2, 3-3, 3-4, 3-5, 3-6, 3-7, and 3-8) Total clay content varies from 48 to 80 percent (mean 67 %; standard deviation 9%). Quartz content ranges from 10 to 34 percent (mean 19 %; standard deviation 7 %). The amount of K-feldspar varies from 3 to 11 percent (mean 6 %; standard deviation 2 %). Plagioclase feldspars are less abundant (1 to 4 %) with a mean value of 2 percent and a standard deviation of 0.8 percent. Siderite abundance ranges from 1 to 8 percent (mean 3.5 %; standard deviation 1.9 %). Pyrite, ankerite, and calcite are minor accessory phases in the marine shales. Clay mineralogy data suggest that these samples represent a single compositional group with relatively limited variability. Wire-line log response is used commonly to estimate total clay content, porosity, and V-shale. A cross-plot of total clay and GR log-response shows improved correlation if the data are considered in terms of shale facies. A graph of measured porosity versus neutron density porosity indicates that log responses tend to over-estimate porosity in argillaceous rocks by an average of 3 to 5 porosity units. Likewise, log evaluation techniques generally over-estimate V-shale values relative to measured total clay content.
Outcrop Analog Seal data(Figures 4-1, 4-2, 4-3, and 4-4; Table 4-1) Shale microfacies are recognizable in closely spaced shale samples from outcrops (Cretaceous, Wyoming). Each shale end-member type has distinctive fabrics, MICP character, and composition. Seal character varies in a predictable manner within a sequence stratigraphic framework. Well laminated, clay- and organic-rich shales from uppermost transgressive units exhibit excellent seal potential. High-resolution sequence stratigraphy reveals that this group of samples in this data set represent three of the six shale types that typify deepwater marine depositional settings. Shale type 2 occurs with 3rd- and 4th-order condensed sections and basal parts of transgressive stratal packages. Shale type 3 occurs mainly with silt- and sand-rich 4th-order lowstand units. Type 6 shales represent the most distal shale facies and record pelagic sedimentation with minimal bioturbation and slow sedimentation. MICP values and porosity are reduced significantly in the upper TST interval relative to all parts of the HST interval. The reduced porosity in clay-rich TST shales is attributed to improved organization of particles (well-developed laminar fabrics) as well as the precipitation of Fe-carbonate cements during early submarine diagenesis. Additionally, there is a major difference in the permeability of TST and HST shales. Within the Lewis HST there is a weak trend of upward increasing permeability; this trend appears to correlate with a vertical increase in the content of detrital silt.
Angola Seal Data(Figures 5-1, 5-2, 5-3, 5-4, 5-5, 5-6, 5-7, and 5-8)
Three distinctive mudstone lithotypes are present in offshore Angola samples based on differences in composition and fabric: silt-rich claystones and argillaceous siltstones; calcareous shales claystones; and silt-poor sideritic claystones. Shapes of mercury-injection curves (MICP analysis) allow the recognition of three classes of pore structure (i.e., seal types). Silt-rich samples (type 4) have relatively low injection pressures. In contrast, carbonate-cemented silt-poor samples (type 2) have injection pressures that exceed 1,000 psia. Type 3 samples have intermediate injection pressures. Each shale type occupies a particular stratigraphic position. Type 2 shales represent upper transgressive and condensed intervals. Type 3 shales occur in middle to lower parts of transgressive units, and very silty (type 4) shales represent lowstand and highstand stratal packages.
Seal StratigraphyEach shale facies occupies a limited stratigraphic range where considered within a high-resolution (wire-line log scale) sequence stratigraphic framework. Enhanced membrane (top) sealing capacity occurs consistently within the upper parts of shale-dominated transgressive units. Lower sealing capacities are characteristic of silty shales from highstand, lowstand and lower parts of transgressive stratal packages.
Summary and ConclusionsSix shale types are recognizable within deepwater marine depositional settings (based on differences in shale fabric and MICP analyses). These shale types appear to correspond with high-frequency (wire-line log scale) stratigraphic fluctuations. Clay-rich shale types 1 and 2 consistently have excellent seal potential. Silt-rich mudstones (shale types 3, 4 and 5) have relatively low seal capacities. There is a strong positive correlation between total clay content and critical seal pressure (10% non-wetting phase saturation). Carbonate-cemented mudstones (shale type 6) can have excellent to exceptional membrane seal capacity, but they are brittle and tend to fracture. Variations in depositional fabric strongly influence seal character. In particular, the presence of laminar fabric, low (<10%) content of detrital silt (siliciclastic and/or bioclastic), and elevated content (> 70%) of detrital clay matrix appear to enhance seal potential of marine shales. Excellent to very good seal capacity is found in shales from uppermost 3rd- and 4th-order transgressive units and some condensed intervals. Shales from silt-rich parts of highstand and lowstand stratal packages have markedly reduced seal capacities. Both silt content and the organization of silt (laminae and mottles) influence seal character. Wire-line log derived parameters appear to have reasonable ability to estimate critical seal pressure in these samples. The entire set of critical injection pressures can be predicted from log-derived bulk density values. Seal capacity for shale type 6 can be predicted from GR-log data.
ReferencesAlmon, W.R., Dawson, Wm. C., Sutton, S.J., Ethridge, F.G., and Castelblanco, B., 2002, Sequence stratigraphy, facies variation and petrophysical properties in deepwater shales, Upper Cretaceous Lewis Shale, south-central Wyoming: GCAGS Transactions, v. 52, p. 1041-1053. Berg, R.R., 1975, Capillary pressures in stratigraphic traps: AAPG Bulletin, v. 59, p. 939-956. Dawson, Wm. C., 2000, Shale microfacies: Eagle Ford Group (Cenomanian-Turonian) north-central Texas outcrops and subsurface equivalents: GCAGS Transactions, v. 50, p. 607-621. Dawson, Wm. C., and Almon, W.R., 2002, Top seal potential of Tertiary deep-water Gulf of Mexico shales: GCAGS Transactions, v. 52, p. 167-176. Dewhurst, D.Y., Yang, Y., and Aplin, A.C., 1999, Permeability and flow in natural mudstones, in Aplin, A.C. et al., eds., Muds and Mudstones, Geological Society London Special Publication 38, p. 23-43. Downey, M. W., 1984, Evaluating seals for hydrocarbon accumulations: AAPG Bulletin, v. 68, p. 1752-1763. Jennings, J.J., 1987, Capillary pressure techniques: application to exploration and development geology: AAPG Bulletin, v. 71 (10), p. 1196-1209. Krushin, J.T., 1987, Seal capacity of non-smectite shales, in R. C. Surdam, ed., Seals, Traps, and the Petroleum System: AAPG Bulletin, v. 67, p. 31-67. Schieber, J., 1999, Distribution of mudstone facies in Upper Devonian Sonyea Group of New York: Journal Sedimentary Research, v. 69, p. 909-925. Showalter, T.T., 1979, Mechanics of secondary hydrocarbon migration and entrapment: AAPG Bulletin, 63, p. 723-760. Sutton, S.J., Ethridge, F.G., Almon, W.R., and Dawson, Wm. C., 2004, Variable controlling sealing capacity of Lower and Upper Cretaceous shales, Denver Basin, Colorado: AAPG Bulletin – accepted for publication. Watts, N.L., 1987, Theoretical aspects of cap-rock and fault seals for single- and two-phase hydrocarbon columns: Marine and Petroleum Geology, v. 4, p. 274-307.
AcknowledgementsWe thank ChevronTexaco for granting permission to present these data and interpretations. W.T. Lawrence prepared thin sections and assisted with photography. E. Donovan and J.L. Jones provided SEM images, and D.K. McCarty completed XRD analyses. R. Lytton offered paleontological data and biostratigraphic interpretations. Poro-Technology, Houston, TX, conducted MICP analyses. Graphic design by L.K. Lovell.
|


