![]() Click to view presentation in PDF format.
Click to view presentation in PDF format.
The Hunt for Acquisition and Drilling Prospect Leads*
By
Mike Cherry1
Search and Discovery Article #40122 (2004)
*Adapted from oral presentation, entitled “Using Industry Applications Software for Analyzing Data to High Grade Acquisition and Drilling Prospects,” at AAPG Mid-Continent Section Meeting, Tulsa, OK, October 12-14, 2003, and at Tulsa Geological Society Meeting, March 9, 2004.
1CEC Energy Consultants, The Woodlands, Texas (www.CECEnergyconsultants.com) ([email protected])
Abstract
Recent years have seen remarkable technological advances in industry applications software that is capable of analyzing large corporate and/or industry databases, giving geoscientists and engineers the capability of high grading and screening acquisition and drilling prospects.
Using industry applications software, geoscientists and engineers can sort
through large datasets to categorize/compile information in order quickly to
make generalizations and gain knowledge and background information on a play or
trend. This presentation will provide many methods for analyzing data in order
to high grade acquisitions, identify field development opportunities, identify
areas within a basin that have significant multiple pay zone potential, set up
regional or basin-type databases for ![]() quick
quick![]()
![]() look
look![]() determinations for auction or
acquisition screening and evaluations, and to focus on hot areas of activity.
determinations for auction or
acquisition screening and evaluations, and to focus on hot areas of activity.
This presentation will also demonstrate methods of how to use industry software applications and industry data to identify areas of permeability and bypassed productive pay zones that either a geoscientist or engineer could use quickly to sort data and generate acquisition and drilling prospect leads.
|
|
Available Industry Software
Figure Captions (1-6)
Mapping Software Tools (Figures 1, 2, and 3) · Landmark – GeoGraphix (Figure 1) · Geoplus – Petra (Figure 2) · Schlumberger – GeoQuest (Figure 3)
Reserves and Economic Software (Figure 4) · IHS – Power Tools · OGRE Partners –OGRE · Landmark – Aries · Schlumberger – Merak Peep
Automated EUR Reserve Estimates (Figure 5)
Access Database Exports (Figure 6)
Common Uses of Mapping Software· Mapping attribute, net pay, isopach, and structure · Cross sections—stratigraphic and structural · Gridding and contouring techniques · Management presentations · Acreage position management · Field development management · Mainly used by drafting and geo-tech personnel
Common Acquisition Prospect Identification· Contact A&D brokers to see what they represent that is for sale. · Auctions · Make contacts of larger companies that typically sell large volumes of properties and attempt a negotiated purchase.
Common Development Drilling Prospect Identification (Figure 7) · Analyze existing HBP acreage position for infill or extensional opportunities. · Analyze offset operators to HBP acreage position for anomalies or drainage problems. · Identify field extension opportunities. · Analyze existing non-producing acreage position for drilling potential..
Under-Utilized Analytical Functions (Figures 8, 9, 10, 11, 12, 13, and 14)
·
Petrophysical and detailed log
·
Volumetric reserve · Identify/compare performance and success · Determine continuity and compartmentalization of reservoirs.
Petrophysical and Detailed Log
|


 |
|
 |
|
 |
Figure 33. Map of well control, of same area as Figure 22, showing wells with difference in initial production rates. |
 |
Figure 34. Database of well data, with transform equation: Pseudo PI = (Cum/(P1-P2)) |
 |
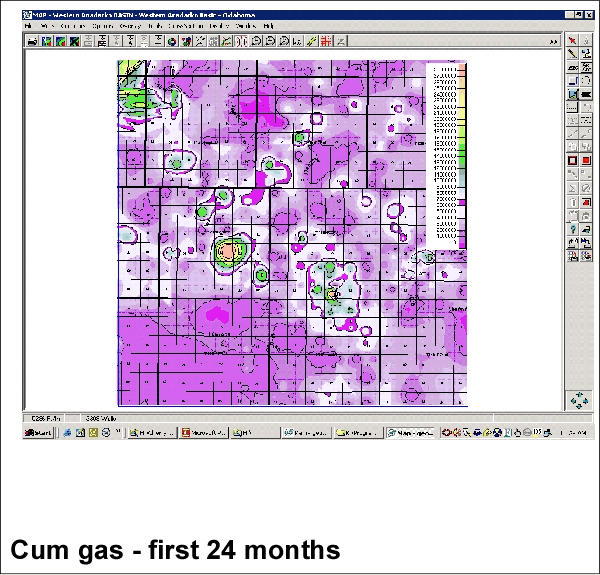
Figure 35. Map of cumulative production for first 24 months of production, along with wells with high pseudo kh (in same area as Figure 29). |
 |
Figure 36. Map showing most positive
curvature (trend |
 |
Figure 37. Map of most positive curvature
(trend |
 |
Figure 38. Structure form map, western Anadarko basin, Oklahoma (as overlay to most positive curvature--Figure 37), with representative key wells highlighted (of 3321 wells). |
Darcy's Radial Flow Equation
Q = (7.08)(kh)(DP) / (Bo )(m)(ln re /rw ), bopd
Q = (0.703)(kh)( DP) / (z)(BHT)( m)(ln re /rw ), mcfd
ln re/rw = 6 to 8; therefore use 7 as a good estimate.
High PI Well Anomalies
· Calculate Productivity Index (PI) for region or basin.
· Identify areas of high PI potential.
· Compare PI’s with EUR’s for anomalies.
Determine PI (Figures 34, 35, 36, 37, and 38)
· Use Darcy’s Equation to calculate and populate zones for mapping and contouring.
· (Q / DP) = (7.08)(kh) / (Bo)(m)(ln re/rw)
· Calculate Bcf/1000 psi or Mmbo/1000psi for each well in region or basin.
· Identify anomalies for acquisition or drilling prospects.