Print this page
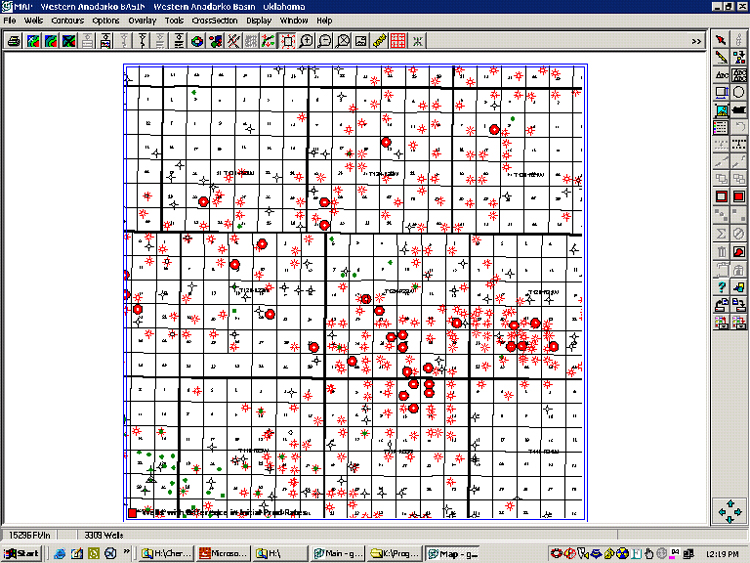
Figure 33. Map of well control, of same area as Figure 22, showing wells with difference in initial production rates.