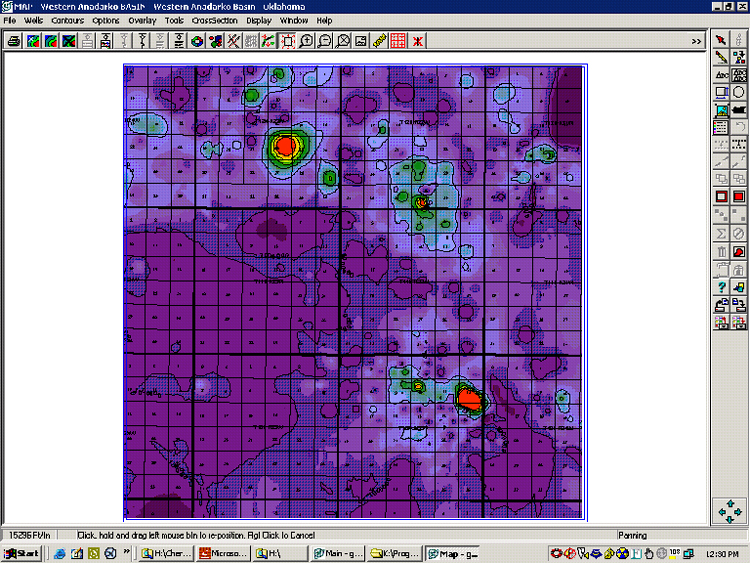
Figure 29. Map of cumulative gas production for first 24 months of production (same general area as Figure 22), with relatively high-k areas highlighted.
Figure 29. Map of cumulative gas production for first 24 months of production (same general area as Figure 22), with relatively high-k areas highlighted.