![]() Click to view text in PDF format.
Click to view text in PDF format.
![]() Click
to view figures (cross sections, index maps, and stratigraphic column) in PDF format.
Click
to view figures (cross sections, index maps, and stratigraphic column) in PDF format.
![]() Click
to view plates (structural maps) in PDF format.
Click
to view plates (structural maps) in PDF format.
![]() Click
to view high-resolution figures in PDF format (PDF file >15 MB).
Click
to view high-resolution figures in PDF format (PDF file >15 MB).
THE
WHITTIER FAULT TREND: CROSS SECTIONS, STRUCTURE MAPS, AND WELL TOPS IN THE MAJOR
![]() OIL
OIL![]() PRODUCING AREA OF THE NORTHEASTERN LOS ANGELES BASIN*
PRODUCING AREA OF THE NORTHEASTERN LOS ANGELES BASIN*
By
Tom Bjorklund1
Search and Discovery Article #10038 (2003)
*Adaptation for online
presentation of selected results of the author’s research for Ph.D.
dissertation. A more comprehensive compilation of the author’s work is presented
on CD-ROM in Search and Discovery CD-ROM Series #1, entitled The
Whittier Fault Trend in the Major ![]() Oil
Oil![]() Producing Area of the
Northeastern Los
Angeles Basin: Interpretation and Data.
This publication is
available from Search and Discovery
[email protected] and AAPG Bookstore (http://bookstore.aapg.org).
Producing Area of the
Northeastern Los
Angeles Basin: Interpretation and Data.
This publication is
available from Search and Discovery
[email protected] and AAPG Bookstore (http://bookstore.aapg.org).
1University of Houston ([email protected])
Understanding the
deep structure of the Los Angeles
basin is critical to the assessment of the seismic hazard as well as the future
petroleum potential in one of the most densely populated regions in the United
States. In the center of the basin, that deep structure is hardly known because
over 6.4 km of Pliocene and younger rocks have buried the rocks that record the
early history of the basin. The acquisition of the modern seismic data that
might reveal the deep structure has not been feasible in this
densely populated area. Fortunately,
just 50 km to the east, evidence of the character of the structure of the deep
Los Angeles basin is accessible
in the outcrops and wells of the
Puente Hills area of the northeastern Los Angeles basin (NELAB). There, Miocene
and older rocks have been
uplifted along the Whittier fault by as much as 4.5 km since ca. 7-8 Ma by N-S
shortening that is linked to the development of the San Andreas fault system.
Thousands of ![]() oil
oil![]() wells have been drilled in the area, some to depths of more
than 3 km.
wells have been drilled in the area, some to depths of more
than 3 km.
Two recent papers together describe an integrated 3-D analysis of this unique window into the Los Angeles basin with the aim of developing a well-constrained geologic model to help in understanding the structural development and seismicity of the region. Bjorklund and Burke (2002) focus on a huge quantity of surface and subsurface data along the Whittier fault and introduce a three-phase model for the evolution of the active fault. Their model establishes relationships between early rifting and later folding and reverse faulting. Bjorklund, et al. (2002) review the evidence for Miocene extension in the NELAB. In that study, relationships established among volcanic rocks, active faults and mid-crustal structures revealed by P-wave tomography indicate that crustal heterogeneities may localize areas of high seismicity. This publication is a set of newly prepared maps, cross sections and tables that substantially supplement the material presented in the two already published papers. Other topics addressed in this publication include: (1) Sources and quality of data, (2) elaborations on previously published interpretations, and (3) aspects that may warrant further study.
The interpretations
in this publication are based on data from a wide range of sources, including a
significant body of interpreted data that has been held by ![]() oil
oil![]() companies. By
making the original data of this publication readily accessible in a digital
format, we hope to facilitate additional research that will result in the
refinement and the enlargement of the existing database and greater public
availability of privately held data
companies. By
making the original data of this publication readily accessible in a digital
format, we hope to facilitate additional research that will result in the
refinement and the enlargement of the existing database and greater public
availability of privately held data
|
uPrefaceuFigure captions (1-3)uGeologic settinguPurpose & contentuSources of datauFormats of filesuCross sections in fieldstCarbon Canyon area, Yorba Linda & Esperanza fields uRegional cross sectionsuStructure mapsuWell datauReferencesuComplete figure captions
uPrefaceuFigure captions (1-3)uGeologic settinguPurpose & contentuSources of datauFormats of filesuCross sections in fieldstCarbon Canyon area, Yorba Linda & Esperanza fields uRegional cross sectionsuStructure mapsuWell datauReferencesuComplete figure captions
uPrefaceuFigure captions (1-3)uGeologic settinguPurpose & contentuSources of datauFormats of filesuCross sections in fieldstCarbon Canyon area, Yorba Linda & Esperanza fields uRegional cross sectionsuStructure mapsuWell datauReferencesuComplete figure captions
uPrefaceuFigure captions (1-3)uGeologic settinguPurpose & contentuSources of datauFormats of filesuCross sections in fieldstCarbon Canyon area, Yorba Linda & Esperanza fields uRegional cross sectionsuStructure mapsuWell datauReferencesuComplete figure captions
uPrefaceuFigure captions (1-3)uGeologic settinguPurpose & contentuSources of datauFormats of filesuCross sections in fieldstCarbon Canyon area, Yorba Linda & Esperanza fields uRegional cross sectionsuStructure mapsuWell datauReferencesuComplete figure captions
uPrefaceuFigure captions (1-3)uGeologic settinguPurpose & contentuSources of datauFormats of filesuCross sections in fieldstCarbon Canyon area, Yorba Linda & Esperanza fields uRegional cross sectionsuStructure mapsuWell datauReferencesuComplete figure captions
uPrefaceuFigure captions (1-3)uGeologic settinguPurpose & contentuSources of datauFormats of filesuCross sections in fieldstCarbon Canyon area, Yorba Linda & Esperanza fields uRegional cross sectionsuStructure mapsuWell datauReferencesuComplete figure captions
uPrefaceuFigure captions (1-3)uGeologic settinguPurpose & contentuSources of datauFormats of filesuCross sections in fieldstCarbon Canyon area, Yorba Linda & Esperanza fields uRegional cross sectionsuStructure mapsuWell datauReferencesuComplete figure captions
uPrefaceuFigure captions (1-3)uGeologic settinguPurpose & contentuSources of datauFormats of filesuCross sections in fieldstCarbon Canyon area, Yorba Linda & Esperanza fields uRegional cross sectionsuStructure mapsuWell datauReferencesuComplete figure captions
uPrefaceuFigure captions (1-3)uGeologic settinguPurpose & contentuSources of datauFormats of filesuCross sections in fieldstCarbon Canyon area, Yorba Linda & Esperanza fields uRegional cross sectionsuStructure mapsuWell datauReferencesuComplete figure captions
uPrefaceuFigure captions (1-3)uGeologic settinguPurpose & contentuSources of datauFormats of filesuCross sections in fieldstCarbon Canyon area, Yorba Linda & Esperanza fields uRegional cross sectionsuStructure mapsuWell datauReferencesuComplete figure captions
uPrefaceuFigure captions (1-3)uGeologic settinguPurpose & contentuSources of datauFormats of filesuCross sections in fieldstCarbon Canyon area, Yorba Linda & Esperanza fields uRegional cross sectionsuStructure mapsuWell datauReferencesuComplete figure captions
uPrefaceuFigure captions (1-3)uGeologic settinguPurpose & contentuSources of datauFormats of filesuCross sections in fieldstCarbon Canyon area, Yorba Linda & Esperanza fields uRegional cross sectionsuStructure mapsuWell datauReferencesuComplete figure captions
uPrefaceuFigure captions (1-3)uGeologic settinguPurpose & contentuSources of datauFormats of filesuCross sections in fieldstCarbon Canyon area, Yorba Linda & Esperanza fields uRegional cross sectionsuStructure mapsuWell datauReferencesuComplete figure captions
uPrefaceuFigure captions (1-3)uGeologic settinguPurpose & contentuSources of datauFormats of filesuCross sections in fieldstCarbon Canyon area, Yorba Linda & Esperanza fields uRegional cross sectionsuStructure mapsuWell datauReferencesuComplete figure captions
uPrefaceuFigure captions (1-3)uGeologic settinguPurpose & contentuSources of datauFormats of filesuCross sections in fieldstCarbon Canyon area, Yorba Linda & Esperanza fields uRegional cross sectionsuStructure mapsuWell datauReferencesuComplete figure captions
uPrefaceuFigure captions (1-3)uGeologic settinguPurpose & contentuSources of datauFormats of filesuCross sections in fieldstCarbon Canyon area, Yorba Linda & Esperanza fields uRegional cross sectionsuStructure mapsuWell datauReferencesuComplete figure captions
uPrefaceuFigure captions (1-3)uGeologic settinguPurpose & contentuSources of datauFormats of filesuCross sections in fieldstCarbon Canyon area, Yorba Linda & Esperanza fields uRegional cross sectionsuStructure mapsuWell datauReferencesuComplete figure captions
uPrefaceuFigure captions (1-3)uGeologic settinguPurpose & contentuSources of datauFormats of filesuCross sections in fieldstCarbon Canyon area, Yorba Linda & Esperanza fields uRegional cross sectionsuStructure mapsuWell datauReferencesuComplete figure captions
uPrefaceuFigure captions (1-3)uGeologic settinguPurpose & contentuSources of datauFormats of filesuCross sections in fieldstCarbon Canyon area, Yorba Linda & Esperanza fields uRegional cross sectionsuStructure mapsuWell datauReferencesuComplete figure captions
uPrefaceuFigure captions (1-3)uGeologic settinguPurpose & contentuSources of datauFormats of filesuCross sections in fieldstCarbon Canyon area, Yorba Linda & Esperanza fields uRegional cross sectionsuStructure mapsuWell datauReferencesuComplete figure captions
uPrefaceuFigure captions (1-3)uGeologic settinguPurpose & contentuSources of datauFormats of filesuCross sections in fieldstCarbon Canyon area, Yorba Linda & Esperanza fields uRegional cross sectionsuStructure mapsuWell datauReferencesuComplete figure captions
|
Abbreviated Figure Captions (1-3) Accompanying Thumbnails(Note: Complete captions with full-scale images.)
GEOLOGIC SETTINGSince the recognition in the 1960s of the role of plate tectonics in the structural history of the earth, significant progress has been made in understanding the evolution of the California borderland. The tectonic events that embody this evolution in the greater Los Angeles basin are the following (Refer to Figure 1 for the location of the San Andreas fault, the Los Angeles basin and the western Transverse Ranges). 1. Beginning ca. 28 Ma, cessation of Pacific plate subduction in the central and southern California area and the evolution of the San Andreas transform fault system (Atwater, 1998). 2. Uplift of metamorphic core complexes represented in the Los Angeles basin by the Catalina Schist and clockwise rotation of the western Transverse Ranges block by more than 90 degrees since ca. 18 Ma (Luyendyk, 1991, Crouch and Suppe, 1993). 3. Lithospheric extension in the wake of the rotating western Transverse Ranges that resulted in the development of regional detachment surfaces (Crouch and Suppe, 1993). 4. In the Los Angeles basin area, cessation of extension at ca. 7-8 Ma and the onset of north-south compression associated with the San Andreas transform fault system, which has produced about 50 km of shortening across the basin (Argus et al., 1999, Bjorklund et al., 2002). In the greater Los Angeles basin area, these events have resulted in the northwest-southeast trending right-lateral strike slip faults of the Peninsular Ranges (Palos Verdes, Newport- Inglewood, Elsinore, San Jacinto and San Andreas) and the east-west trending left-lateral oblique slip faults of the western Transverse Ranges (Santa Monica, Hollywood, Raymond, Sierra Madre-Cucamonga) (Figure 1). Metamorphic rocks of an accretionary-wedge complex (ca. 160 Ma), magmatic-arc rocks of the Southern California batholith (ca. 120-95 Ma) and forearc sedimentary rocks (ca. 90-49 Ma?) make up the cores of the uplifts produced by these faults. The intervening basins have been filled with Miocene and younger sedimentary deposits and volcanic rocks (ca. 16-0 Ma). The sedimentary rocks consist predominantly of turbidites that have been shed from the surrounding uplifts. The Puente Hills of the northeastern Los Angeles basin are located west and northwest of the Peninsular Ranges and southeast of the Transverse Ranges but are not clearly associated with either geomorphic province (Figure 1 and Figure 2). This dilemma has led to conflicting interpretations of the structural development of the area. From north to south, the Puente Hills anticline, the Whittier fault, which trends N70oW and cuts the steeply dipping south limb of the anticline along a 40 km strike-length, and the La Habra syncline characterize the structural setting of the Puente Hills (Figure 2). Basement rocks that underlie the Puente Hills exhibit as much as 14000 feet of vertical separation due to folding and offset along the Whittier fault (cf. Yerkes, 1972, p. 29). Most studies of the Whittier fault have concluded that movement on the Whittier fault has been predominantly right-lateral strike slip, but a consensus has not been reached on the amount of horizontal separation. Estimates of horizontal displacement have ranged from nearly one mile to 25 miles (English, 1926, Hill, 1954, Woodford, 1954, Lamar, 1961, Durham and Yerkes, 1964, Yerkes, 1972, Sage, 1975, Wright, 1991, McCulloh et al., 2000). Offsets of more than about 15 miles would not be compatible with the late Pliocene (2.5 Ma) origin now ascribed to the Elsinore fault (Hull and Nicholson, 1992) and would necessarily be related to a different kinematic regime. Gourley (1975) and Davis et al. (1989) do not require any horizontal displacement on the Whittier fault. One paleoseismic study of excavated trenches concluded that Upper Quaternary channel sandstones had been offset 9-26 m in a right-lateral strike slip sense and estimated the ratio of lateral to vertical slip at 12:1 (Gath et al., 1992). Radiocarbon dates from those trenches indicated that the faulting took place within the past 17,000 years.
Our 4-D analysis of
the available data shows that, although a small component of strike slip
separation is required, dip-slip separation has been predominant on the
Whittier fault during most of the past 8 My. Our review of previous
studies of displacements on the
Whittier fault suggests that a strike-slip transport
direction has not been unequivocally established because of inherent
uncertainties in across-the-fault correlations and poorly constrained
piercing points. The amounts of uncertainty could well be as great as the
estimated offsets. We have proposed a three-phase evolution of the
Whittier fold-fault
system (Bjorklund and Burke, 2002). That evolution began with extensional
phase volcanism (16-14 Ma) and the formation of the Puente Hills half-graben
along a proto-Whittier normal fault (14-8 Ma) and concluded with the
compressional inversion of the half-graben to form the present Puente
Hills anticline, the through-going Whittier reverse fault system and the
La Habra syncline (8-0 Ma). Maximum burial of the hydrocarbon source rocks
of the La Vida Member, the formation of
PURPOSE AND CONTENT
The purpose of this
publication is to make available, in an accessible and usable format, a
core database on the geology of the northeastern Los Angeles basin (Figure
1 and
Figure
2).
The document emphasizes the structural and stratigraphic relationships of
the Upper Miocene Puente Formation and the Lower Pliocene Fernando
Formation, which are intensely drilled and represent the main
This publication
consists of a series of 22 large-scale cross sections of SOURCES OF DATA
Aera Energy LLC
(formerly Shell Surface geology interpretations are based on preliminary 7.5 minute series digital geologic maps obtained from the Southern California Areal Mapping Project (SCAMP), a cooperative mapping project between the U.S. Geological Survey and the California Geological Survey, published reports (Durham and Yerkes, 1964, Yerkes, 1972, Schoellhamer et al., 1981 and Gath et al., 1992) and field observations of the author.
A preliminary
basemap for this study was compiled from paper copies of DOGGR field maps
and regional wildcat maps and reduced to a scale of 1: 24000. Parts of the
study area have not been surveyed for section, township and range corners,
and well locations on maps in those areas are not as
accurately located as in other areas. Differences between well locations
on operator maps and DOGGR maps are, also, common throughout the area.
Finally, the digital well locations do not always match the well locations
shown on either the DOGGR maps or the operator maps. For this study, the
digital well locations have been used wherever possible. However, in some
areas, the well locations in the digital database have been modified to
fit the well locations provided by the operators, such as in Esperanza
FORMATS OF FILES
As noted above, a
comprehensive version of the Whittier fault study, entitled
The
Whittier Fault Trend in the Major The original files from which the maps for this study have been created are ARC/INFO coverages in the Universal Transverse Mercator coordinate system (Zone 11, NAD 27). These files are included in the CD-ROM Coverage directory as ARC export interchange files (.e00 filename extensions) and as standard ARC coverages. The coverages are also available as Arc shape files in the CD-ROM Shapes directory. A freeware copy of ARCEXPLORER, which has been included in the CD-ROM Arcexpl2 directory, can be used to view the shape files and coverages. The export interchange files can be converted to coverages at ARC with the command IMPORT COVER <INTERCHANGE FILE NAME> <OUTPUT COVERAGE NAME>. In ARC/INFO, xyz files can be generated from the coverages and used in applications to create 3-D images and to carry out structural analyses. Maps that have been created from the coverages for this publication are included in the CD-ROM Plates directory as PDF images. A symbol set, alcgeol.mrk, created by the USGS to render oriented geologic structure symbols, such as strike and dip symbols, is included in the Coverage directory (See Alacarte for additional information on specialized geologic symbol sets.). The content or theme of each file can be determined by referring to the following explanations of file name abbreviations.
dogwell = California Division of
nb = north fault block or hanging wall block of the Whittier fault. sb = south fault block or footwall block of the Whittier fault. sections = index map showing locations of cross sections in figures. tps = top of Soquel Member of Puente Formation. tpsc = top of Sycamore Canyon Member of Puente Formation (base of Lower Fernando Member). oc = outcrop well = map showing surface locations of wells. top(s) = map showing locations of the elevations in the wellbore, which will be different from the surface well locations for directionally drilled wells. wf = Whittier fault protowf = proto-Whittier fault flt = fault The original files of the cross sections were created on a PC using Canvas5 and are in the CD-ROM Canvas directory. Tables in Excel format are in the CD-ROM Tables directory. An Arc grid export interchange file of the northeastern Los Angeles basin, which is a mosaic of 11 USGS 10 meter, 7.5 minute Digital Elevation Models (DEMs), is in the CD-ROM Dem directory.
CROSS SECTIONS IN BREA-OLINDA, YORBA LINDA, AND ESPERANZA Figure Captions (4-26) Accompanying Thumbnails(Note: Complete caption of Figure 4 with full-scale image.)
Click here to view sequence of cross sections along Whittier fault—from southeast to northwest (Figures 23, 20, 13, 9, 5). Return to top.
Description
Twenty-two cross
sections along the 8 mile central segment of the Whittier fault
system form the core dataset for the study (Figure 4, Figures 5-26). The cross sections consist of scanned images of wellbore
locations, geophysical log curves (a spontaneous potential or gamma ray
and resistivity curve), maximum bedding dips from core and dipmeter data
(not corrected for strike of sections), paleontological data (see Wissler,
1943, Blake, 1991 and Barron and Isaacs, 2001 for discussions of
microfaunal divisions), and local correlations established by Shell
Puente Hills Area of the Northwest Brea-Olinda
Along this segment
of the Whittier fault, the contacts between Pliocene and Miocene
strata and Delmontian and Mohnian strata are not well established. Shell
The correlations locally of individual sandstone units are well defined by hundreds of closely spaced wells. In the footwall block of the Whittier fault, steeply south-dipping, channel-shaped, Lower Pliocene and Upper Miocene sandstone units pinchout updip, generally more than 2000 feet from the main Whittier fault. On Figure 9, updip from the sandstone pinchouts, paleontological data show that the Yorba Member underlies the Lower Fernando Member, which demonstrates the absence updip of strata equivalent to the Sycamore Canyon Member and is the best evidence in the study area for the early growth of the Whittier fault. The structural and stratigraphic details of isolated sandstone units within a fault slice near the Whittier fault, termed “D” sands and Ballard sands by the operator, are not as well known. The correlation of these sandstones with the downdip Soquel sandstone has been established by using paleontological data and bedding dips from cores and dipmeters (Figure 8 and Figure 9).
The Whittier fault
has been intersected by numerous wellbores in northwest Brea-Olinda and is
well defined at shallow depths. However, the surface trace of the fault is
usually covered by colluvium and only approximately located. Wells drilled
from the hanging wall block penetrate La Vida strata juxtaposed against
Fernando strata in the footwall block (Figure
6). Several
wellbores, directionally-drilled from the footwall block, cross the
Whittier fault from Soquel
sandstone or Division D strata into lower La Vida strata or
metavolcanic basement rocks in the hanging wall block at depths between
3000 and 6000 feet (cf.
Figure 6
and
Figure 7).
Yerkes (1972) places the
Whittier fault trace along the southern boundary of a
fault-bounded slice of Yorba siltstone. Previous workers (Shell
Brea and
Tonner Canyon
Areas
of Central Brea-Olinda
The Tonner and
Menchego faults (operator terminology) are the dominant structural
features of the central area of the Brea-Olinda The relationship of the Tonner and Menchego faults to the proto-Whittier fault (See Bjorklund and Burke, 2000) for a discussion of the proto-Whittier fault), which is critically important in understanding the evolution of the Whittier fault system, is well defined by surface and well data in this area. A diabase unit crops out for a distance of about 3000 feet just north of Brea Canyon, and its south contact, which is covered by alluvial deposits, marks the location of the proto-Whittier fault (cf. Yerkes) (Figure 11). Tan et al. (1984) extend the proto-Whittier fault trace about 8000 feet to the southeast with decreasing throw, showing the La Vida siltstone on the north in fault contact with the Soquel sandstone on the south. Farther to the southeast, the contact between the La Vida and Soquel Members has been interpreted to be depositional, and the subsurface location of the proto-Whittier fault has been inferred from surface folding and several thousand feet of separation of lower La Vida strata. The relationships shown on Figure 23 and nearby cross sections establish that uplift of the north block of the Whittier fault system has been formed by (1) inversion of the Whittier half-graben that has been accommodated by displacement on the Menchego and Tonner faults, with dips approximately the same as the inferred dip of the Whittier fault in the basement, (2) by displacement on the proto-Whittier fault and (3) by folding (Bjorklund and Burke, 2002). The southernmost, throughgoing fault at the surface in this area, which is the Tonner fault, has been mapped as the Whittier fault in this publication.
Carbon
Canyon Area of Southeast Brea-Olinda The Lower Fernando Member is unusually thick in the Carbon Canyon area due to the presence of a lower interval of conglomeratic sandstones, termed “A” sands by the operator (Figure 19 and Figure 20), that are not present in the outcrops farther to the east. Isolated outcrops within the Carbon Canyon floodplain have been identified by Durham and Yerkes (1962) and Tan et al. (1984) as the Sycamore Canyon Member but probably correlate with the Lower Pliocene “A” sands. On the maps and cross sections in this publication, the location of the base of the Lower Fernando Member below the alluvial cover as interpreted by Tan et al. (1984) and Durham and Yerkes (1962) has been modified to reflect the presence of the “A” sands. About 1300 feet northwest of Figure 17 along the strike of the Whittier (Tonner) fault, trenching was conducted to look for evidence of recent movement on the Whittier fault near Olinda Creek (Gath et al., 1992) (See Bjorklund and Burke, 2002 for additional discussion of the trenching). Although the conclusions of the study on fault kinematics are not convincing, the trenches established a dip on the Whittier fault of about 25 degrees to a depth of 10 feet. The Tonner fault , which has a north dip of 55 degrees in the subsurface, or a related splay fault may flatten at the surface in this area.
Between Brea-Olinda
and Esperanza
Outcrops in the
area of Esperanza have been highly deformed in the core of the La Habra
syncline. Tan et al. (1984) interpreted the relationships of outcrops of
the Sycamore Canyon and Yorba Members in this area to reflect tight
folding. Durham and Yerkes (1964) instead invoked a complex pattern of
faults to explain the outcrop distribution. The well data in Esperanza
field are no easier to interpret, but the simplest interpretation is one
in which the deformation has been accommodated mainly by flexural slip and
not by faulting (Figure 24). This interpretation is based on abundant dipmeter and
paleontologic data. The deformational style is compatible with the likely
mechanical properties of the uniform section of the relatively thin,
alternating sandstone and siltstone beds that characterize the
Sycamore Canyon
and Yorba Members in the area. A similar deformational style is present at
Whittier
Figure 25
and
Figure 26,
extending from Yorba Linda
REGIONAL CROSS SECTIONSAbbreviated Figure Captions (27-36) Accompanying Thumbnails (Note: Complete captions with full-scale images.)
Click here to view sequence of cross sections of Whittier fault and associated structures from southeast to northwest (Figures 27, 29, 31, 34).
Description
Ten regional cross
sections have been constructed to provide a wider, 3-D perspective within
which to view the structural interpretation of the Whittier fault and to
insure that the structural contour maps are reasonable and consistent
across the study area (Figures 27, 28, 29, 30, 31, 32, 33, 34, 35, and 36).
See
Figure 4
for the
locations of the cross sections.). Figures 27, 28, 29, 30, 31, 32, 33, 34, 35, and 36 together with the
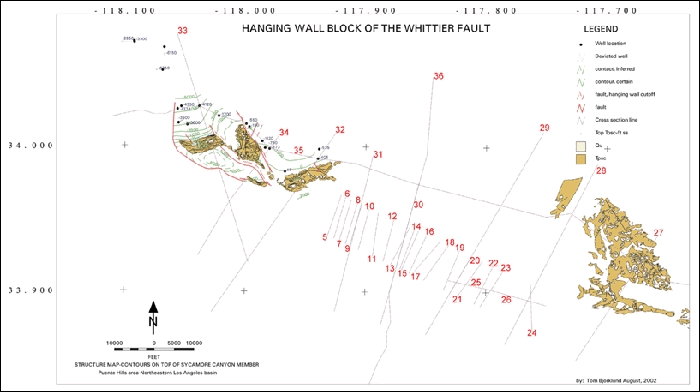
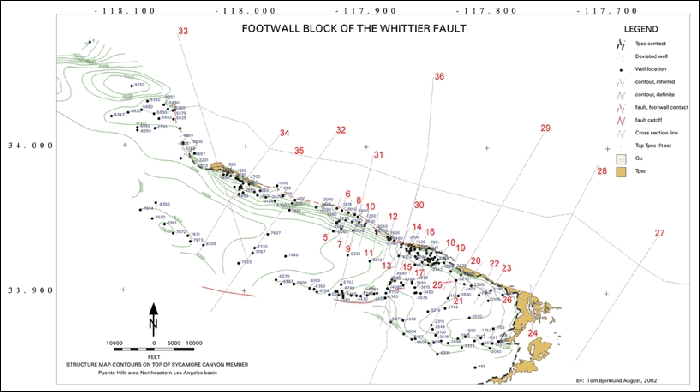
STRUCTURE MAPSPlate Captions (1-6)
Click here to sequence of maps of hanging wall block (Plates 1, 3). Click here to view sequence of maps of footwall block (Plates 2, 4).
The absence of any
single lithologic unit that can be correlated continuously across the
study area and the lithologic similarities of many of the rock units
create difficulties in the construction of area-wide structure maps and a
dependence on paleontologic data to establish correlations. In practice,
boundaries of formation members have been extended from areas with
paleontologic data on the basis of lithologic characteristics. The highest
quality well data are assumed to be those data that have been obtained
from the operators. For example, the well data from Aera Energy in Brea-Olinda
To avoid overlap of structural contours, the structure contour maps on the top of the Sycamore Canyon Member and the top of the Soquel Member are shown on separate maps of the hanging wall and footwall blocks of the Whittier fault (Plates 1, 2, 3, and 4). For small reverse faults within the footwall block, only the hanging wall cutoffs have been shown on the maps. Both the hanging wall and footwall cutoffs are shown for the larger normal faults in the hanging wall block. The Sycamore Canyon structure map of the footwall block (Plate 2), which is based on more well data than the Soquel structure map of the footwall block (Plate 4), has been used to estimate the depths to the Soquel Member in areas of no well control. Estimates of the depths to the top of the Soquel Member and the top of the Sycamore Canyon Member in the axial area of the La Habra syncline are based on projections from wells on the flanks of the structure. Due to erosion, the top of the Sycamore Canyon Member can only be reliably mapped over the northwest part of the hanging wall block of the Whittier fault (Plate 1). Although the top of the Soquel Member has been eroded over the crest area of the Puente Hills anticline in the hanging wall block, the lower part of the Soquel Member is present in scattered outcrops, and a restored elevation of the top of the Soquel Member can be reliably estimated in those areas (Plate 3). In areas of closely spaced wells, all well data are not shown on the structure maps to avoid overprinting.
The Whittier fault has
been mapped as a continuous fault from the Santa Ana Canyon to the
Whittier Narrows (Durham and Yerkes, 1964, Yerkes, 1972 and Tan, et al.,
1984) (Plate 5).
The southeasternmost outcrop of the Whittier fault is located at Bee
Canyon, north of the Santa Ana River (Tan et al., 1984). Southeast of that
point, the Whittier fault is covered by alluvium (See Bjorklund and
Burke, 2002 for additional discussion of this area). Between Brea-Olinda
WELL DATATable 1. Wells in hanging wall block with elevations of base Fernando. Table 2. Wells in footwall block with elevations of base Fernando. Table 3. Wells in hanging wall block with elevations of top Soquel. Table 4. Wells in footwall block with elevations of top Soquel. Table 5. Wells with elevations of Whittier fault. Table 6. Wells with elevations of proto-Whittier fault. Table 7. All wells with elevations of base Fernando, top Soquel and faults. Table 8. All wells in study area. Table 9. Well status codes for wells contained in the database.
DescriptionTables 1, 2, 3, 4, 5, and 6 show the wells used in the construction of the six structure contour maps (Plates 1, 2, 3, 4, 5, and 6), including the elevations of the contoured horizons in the wells. The well coordinates included in the tables are the bottom hole locations of the horizons in the wellbores. For directionally drilled wells, these coordinates will differ from the surface locations of the wells. Table 7 is combined list of all wells for which elevations of the top of the Sycamore Canyon Member, the top of the Soquel Member, the proto-Whittier fault and the Whittier fault have been compiled. Table 8 is a list of the nearly 8,000 wells in the study area that are in the DOGGR District 1 preliminary digital well database (last updated for this publication in August 2000). The well coordinates included in these tables are the surface locations for most of the wells, but well coordinates have not yet been determined by the DOGGR for all of the wells. Table 9 is a list of the meanings of the DOGGR well status codes (status column in the tables).
REFERENCESBanks, P. O., and Silver, L. T., 1966, Evaluation of the decay constant of uranium-238 from lead isotope ratios. Journal of Geophysical Research, v. 71, no.16, p. 4037-4046. Barron, J. A., and Isaacs, C. M., 2001, Updated chronostratigraphic framework for the California Miocene. In: Isaacs, C. M., Rullkotter, J. (Eds.). The Monterey Formation: From rocks to molecules. Columbia University, New York, p. 393-395. Berggren, W. A., Kent, D. V., Swisher, C. C., and Aubry, M-P., 1995, A Revised Cenozoic Geochronology and Chronostratigraphy. In: Berggren, W. A., Kent, D. V., Aubry, and M-P, Hardenbol, J. (Eds.). Geochronology time scales and global stratigraphic correlations. Society of Economic Paleontologists and Mineralogists Special Publication No. 54, pp. 129- 212. Birch, F., 1960, The velocity of compressional waves in rocks to 10 kilobars, 1: Journal of Geophysical Research, v. 65, p. 1083-1102. Bjorklund, T., and Burke, K., 2002, Four-dimensional analysis of the inversion of a half-graben to form the Whittier fold-fault system of the Los Angeles basin. Journal of Structural Geology, v. 24, no. 9, p. 1369-1397. Bjorklund, T., Burke, K., Yeats, R. S., and Zhou, H., 2002, Miocene rifting in the Los Angeles basin: Evidence from the Puente Hills half-graben, volcanic rocks and P-wave tomography. Geology, v. 30, no. 5, p. 447-450. Blake, G. H., 1991, Review of the Neogene biostratigraphy and stratigraphy of the Los Angeles basin and implications for basin evolution. In: Biddle, K. T. (Ed.). Active margin basins. American Association of Petroleum Geologists Memoir 52, p. 135-184.
Durham, D. L., and
Yerkes, R. F., 1964, Geology and Fife, D. L., Minch, J. A., and Crampton, P. J., 1967, Late Jurassic age of the Santiago Peak Volcanics, California. Geological Society of America Bulletin, v. 78, no. 2, p. 299-303. Herzog, D. W., 1998, Subsurface structural evolution along the northern Whittier fault zone of the eastern Los Angeles basin, Southern California. Master’s thesis, Oregon State Univ. Ingersoll, R. V., Rumelhart, P. E., 1999. Three-stage evolution of the Los Angeles basin, Southern California. Geology, v. 27, no. 7, p. 593-596. Imlay, R. W., 1964, Middle and Upper Jurassic fossils from southern California. Journal of Paleontology, v. 38, p. 505-509. Gath, E. M., Gonzalez, T., and Rockwell, T. K., 1992, Evaluation of the Late Quaternary rate of slip, Whittier fault, Southern California. U.S. Geological Survey Final Technical Report-Contract No. 14-08-0001-G1696.
Lang, H. R., 1978,
Late Cretaceous biostratigraphy of the southeastern Los Angeles basin.
California Division of Larsen, E. S., Jr., Gottfried, D., Jaffee, H. W., and Waring, C. L., 1958, Lead-alpha ages of the Mesozoic batholiths of North America. U. S. Geological Survey Bulletin 1070-B, p. 35-62. McCulloh, T. H., Beyer, L. A., and Enrico, R. J., 2000, Paleogene strata of the eastern Los Angeles basin, California: paleogeography and constraints on Neogene structural evolution. Geological Society of America Bulletin, v. 112, no. 7, p. 1155-1178. Mayer, L., 1991, Central Los Angeles basin: Subsidence and thermal implications for tectonic evolution. In: Biddle, K. T. (Ed.). Active margin basins. American Association of Petroleum Geologists Memoir 52, p. 185-195. Shaw, J.H., and Shearer, P.M., 1999, An elusive blind-thrust fault beneath metropolitan Los Angeles: Science, v. 283, p. 1516-1518. Shelton, J.S., 1955, Glendora volcanic rocks, Los Angeles basin, California: Geological Society of America Bulletin, v. 66, p. 45-89. Schoellhamer, J. E., Vedder, J. G., Yerkes, R. F., and Kinney, D. M., 1981, Geology of the northern Santa Ana Mountains, California. U. S. Geological Survey Professional Paper 420-D. Tan, S. S., Miller, R. V., and Evans, J. R., 1984, Environmental geology of parts of the La Habra, Yorba Linda and Prado Dam quadrangles, Orange County, California. California Division of Mines and Geology Open-File Report 84-24. Turner, D. L., 1970, Potassium-argon dating of Pacific Coast Miocene foraminiferal stages. Geological Society of America Special Paper 124, p. 91-129. Treiman, J. A., 1991, Whittier fault zone, Los Angeles and Orange Counties, California. California Division of Mines and Geology Fault Evaluation Report FER-222. West, J.C., and Redin, T. W., 1991, Correlation section across eastern Los Angeles basin from San Pedro Bay to San Gabriel Mountains CS 29. American Association of Petroleum Geologists, Pacific Section.
Wissler, S. G.,
1943, Stratigraphic Formations of the producing zones of the Los Angeles
basin
Woodford, A. O.,
Shelton, J. S., and Moran, T. G., 1944, Geology and
Woodward, A. F.,
1958, Sansinena
Yeats, R. S., and Beall, J. M., 1991, Stratigraphic
controls of
Yerkes, R. F., 1972, Geology and Yerkes, R.F., 1957, Volcanic rocks of the El Modeno area, Orange County, California. Reston, Virginia, U. S. Geological Survey Professional Paper 274-L, p. 313-334. Zhou, H., 1994, Crustal P and S velocities in southern California from a master station inversion using Fresnel volume rays: Eos (Transactions, American Geophysical Union), v. 75, no. 44, p. 483-484. COMPLETE FIGURE CAPTIONS ACCOMPANYING FULL-SCALE IMAGESFigure 1. Index map of the Los Angeles basin and surrounding uplifts. Red dashed rectangle shows the area covered by the maps in this document (See Figure 2 for shaded relief map of area.). Northeastern Los Angeles basin (NELAB), Chino fault (CF), Elysian Park Anticline (EPA), Palos Verdes Hills (PVH), San Gabriel Valley (SGV), San Jacinto Valley (SJV), San Jose Hills (SJH), Santa Ana Mountain Boundary Fault (SAMBF). Figure 2. Shaded relief map of the northeastern Los Angeles basin (Mosaic of 11 USGS 10 meter 7.5 minute Digital Elevation Models (DEMS) with 3x vertical exaggeration). Chino fault (CF), Rio Hondo (RH), San Gabriel river (SGR), San Jose Hills (SJH), Santa Ana Mountains (SAM), Santa Ana river (SAR), Whittier Heights fault (WHF), Workman Hills fault (WoHF).
Figure 3.
Stratigraphic column. Green bar shows
Figure 4.
Index map of cross sections.
Figure 5. Cross
section of Sansinena
Figure 6. Cross
section (a) of Brea-Olinda
Figure 7. Cross
section (b) of Brea-Olinda
Figure 8. Cross
section (a) of Brea-Olinda
Figure 9. Cross
section (b) of Brea-Olinda
Figure 10. Cross
section of Brea-Olinda
Figure 11. Cross
section of Brea-Olinda
Figure 12. Cross
section of Brea-Olinda
Figure 13. Cross
section (a) of Brea-Olinda
Figure 14. Cross
section (b) of Brea-Olinda
Figure 15. Cross
section (c) of Brea-Olinda
Figure 16. Cross
section of Brea-Olinda
Figure 17. Cross
section of Brea-Olinda
Figure 18. Cross
section of Brea-Olinda
Figure 19. Cross
section of Yorba Linda and Brea-Olinda
Figure 20. Cross
section of Yorba Linda
Figure 21. Cross
section (a) of Yorba Linda
Figure 22. Cross
section (b) of Yorba Linda
Figure 23. Cross
section (c) of Yorba Linda
Figure 24. Cross
section of Esperanza
Figure 25.
Longitudinal cross section of Yorba Linda
Figure 26.
Longitudinal cross section of East Yorba Linda
Figure 27.
Southeastern segment of the Whittier fault across Santa Ana Canyon.
Interpretation of hanging-wall block of Santa Ana Mountain Boundary Fault
(footwall block of Whittier fault) is based mainly on surface mapping of
Durham and Yerkes (1964) and Schoellhamer et al. (1981) and wells not on
section. Interpretation of hanging-wall block of Whittier fault below well
depths is based on the thickness of the Cretaceous sequence in Prado
Petroleum Government No. 165-1 well (Lang, 1978), located 3.3 km southeast
of the section line, and the extrapolation of outcrop data from the Santa
Ana Mountains. The base of the Lower Fernando Member is approximately
located with unpublished microfaunal data (Aera Energy LLC) from Grayco
Figure 28.
Kraemer
Figure 29.
Richfield
Figure 30. Central segment of the Whittier
fault across Brea-Olinda
Figure 31. East
Coyote
Figure 32.
La Mirada
Figure 33. Leffingwell
Figure 34. Northwestern segment of the
Whittier fault from Whittier
Figure 35.
Puente and the Chino Hills from Montebello
Figure 36.
Anaheim nose to East Coyote |
 Figure 3
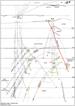 Figure 5. Cross
section of Sansinena
Figure 5. Cross
section of Sansinena 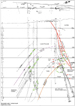 Figure 6. Cross
section (a) of Brea-Olinda
Figure 6. Cross
section (a) of Brea-Olinda 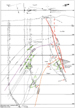 Figure 7. Cross
section (b) of Brea-Olinda
Figure 7. Cross
section (b) of Brea-Olinda 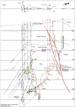 Figure 8. Cross
section (a) of Brea-Olinda
Figure 8. Cross
section (a) of Brea-Olinda 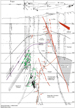 Figure 9. Cross
section (b) of Brea-Olinda
Figure 9. Cross
section (b) of Brea-Olinda 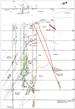 Figure 10. Cross
section of Brea-Olinda
Figure 10. Cross
section of Brea-Olinda 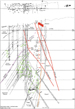 Figure 11. Cross
section of Brea-Olinda
Figure 11. Cross
section of Brea-Olinda 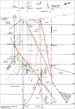 Figure 12. Cross
section of Brea-Olinda
Figure 12. Cross
section of Brea-Olinda 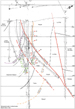 Figure 13. Cross
section (a) of Brea-Olinda
Figure 13. Cross
section (a) of Brea-Olinda  Figure 14. Cross
section (b) of Brea-Olinda
Figure 14. Cross
section (b) of Brea-Olinda 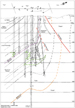 Figure 15. Cross
section (c) of Brea-Olinda
Figure 15. Cross
section (c) of Brea-Olinda 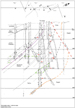 Figure 16. Cross
section of Brea-Olinda
Figure 16. Cross
section of Brea-Olinda 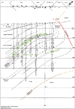 Figure
17. Cross section of Brea-Olinda
Figure
17. Cross section of Brea-Olinda  Figure
18. Cross section of Brea-Olinda
Figure
18. Cross section of Brea-Olinda 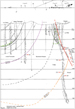 Figure 19. Cross
section of Yorba Linda and Brea-Olinda
Figure 19. Cross
section of Yorba Linda and Brea-Olinda 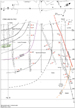 Figure 20. Cross
section of Yorba Linda
Figure 20. Cross
section of Yorba Linda 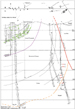 Figure 21. Cross
section (a) of Yorba Linda
Figure 21. Cross
section (a) of Yorba Linda 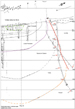 Figure 22. Cross
section (b) of Yorba Linda
Figure 22. Cross
section (b) of Yorba Linda 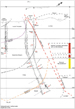 Figure 23. Cross
section (c) of Yorba Linda
Figure 23. Cross
section (c) of Yorba Linda 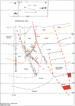 Figure 24. Cross
section of Esperanza
Figure 24. Cross
section of Esperanza  Figure 25.
Longitudinal cross section of Yorba Linda
Figure 25.
Longitudinal cross section of Yorba Linda  Figure 26.
Longitudinal cross section of East Yorba Linda
Figure 26.
Longitudinal cross section of East Yorba Linda 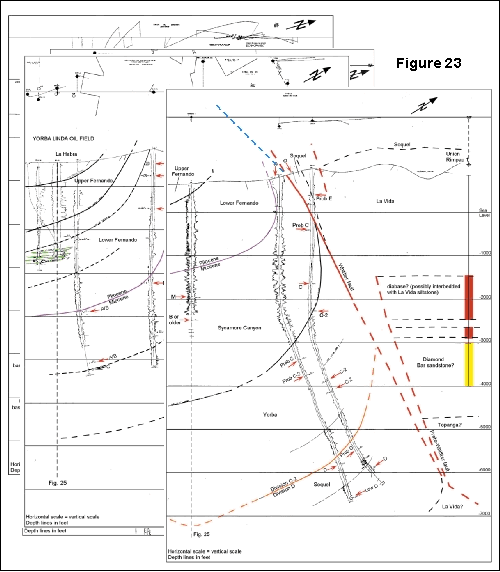