[First Hit]

Datapages, Inc.Print this page

Click to view this article in PDF format.

Value of Applied Research and Future of Previous HitNaturalNext Hit Previous HitGasNext Hit Supply:
How the U.S. Previous HitNaturalNext Hit Previous HitGasNext Hit Production Curve Was Built
and How It Will Be Sustained in the Future

 Scott W. Tinker and Eugene M. Kim

Bureau of Economic Geology
The University of Texas at Austin

 This article, which is posted also at Bureau of Economic Geology’s website, http://www.beg.utexas.edu, represents a combination of two talks given by the authors--The Value of Upstream Technology and the Future of Applied Research, by the senior author in the period from October, 2000, to June, 2001, and U.S. and Texas Gas Supply: Where We Are Now and Where We Are Headed? by both authors in February, 2001. Appreciation is expressed to B.E.G. and to Dr. Tinker for permission to present the article here.


tAbstract

tFigure Captions (1-10)

tIntroduction

tThe Value of Research

tFigure Captions (11-25)

tProduction as a Metric for Research Value

     tOil

     tPrevious HitNaturalNext Hit Previous HitGasNext Hit

tFigure Captions (26-28)

tMeeting Future U.S. Energy Demand

     tProduction

     tImports

tEnergy Research

tSummary

tReferences

ABSTRACT

Previous HitNaturalNext Hit Previous HitgasNext Hit is the energy of choice for the next 15 to 20 years. Data show that Federal and private investment in research, and the creative application of technology helped build the historical Previous HitnaturalNext Hit Previous HitgasNext Hit production curve in the United States. Research and the creative application of technology will likewise grow Previous HitnaturalNext Hit Previous HitgasNext Hit production and slow oil production decline in the future. The private energy sector has decreased fossil energy research funding significantly over the past decade. The American public must get behind Federal support of fossil energy research if we are to avoid dependence on foreign sources of Previous HitnaturalNext Hit Previous HitgasNext Hit. The private sector can also be proactive by creating a Private Energy Research Foundation (PERF) to help fund vital fossil energy research.

Figure Captions-Introduction & The Value of Research


Introduction

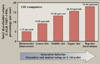
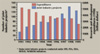
Technology is a word that has become so overused that it actually means very little without some context. A geologist might think of 3-D models, a petrophysicist, logging tools, a geophysicist, waves, a reservoir engineer, numerical simulation, an operations engineer, drilling and completions, and a manager might consider the leverage that technology provides on Wall Street. The word means many things to many people. In fact, all of these definitions are important, all are correct, and all are useful within a known context. One thing is certain: technology does not equal wisdom, and technology alone does not add value.

A company needs both profit and value to survive over the long run. I consider value to be a longer-term attribute than profit, which carries a fiscal quarter connotation. In the descriptive, interpretive, research-oriented upstream-upstream world of the geologist, geophysicist, and petrophysicist, it is considerably more difficult to quantify value than in the quantified, blueprint, application-oriented downstream-upstream world of the operations engineer (Figure 1). Value is difficult to quantify in the upstream-upstream, and it is therefore difficult to assign, because it is far removed from the point where oil fills the tank and gas fills the pipeline. The resulting mistake that is commonly made is to consider the upstream-upstream a cost. I call this the value trap.

Many major oil companies fell into the value trap over the past decade when they asked their Research Centers to become Technology Centers, which in the end meant 100% technical service and very little innovative research. Technology Centers were asked to justify their existence using a quarterly profit metric. In fact, scientists at Technology Centers were asked to "bill out" to customers within the company at some hourly or daily rate. Lawyers and accountants perform a service and quantify value by billable hours; research scientists should not. One is service, the other is science. To those of us who were in the science trenches at major Technology Centers, the result was predictable. Based upon the billable-hour metric, Centers were shown to be unprofitable, and a vast majority were closed. There were, of course, other business justifications for closing Technology Centers. For example, "does not fit the strategic objectives of the company," "technology should be borrowed not invented in house," and "we should contract the technology as needed." Time will tell the wisdom of these decisions.

In actuality, true research is represented by long periods of normalcy with no apparent progress or results, which are punctuated by moments of brilliance and significant breakthrough. As such, research does not lend itself to quarterly profit evaluation. In fact, today's research often becomes tomorrow's technology application. An oil company could certainly not be profitable with research alone, but can it be valuable without it?

The Value of Research

Quantifying the value of research is an age-old dilemma. What is the value of knowing that seismic amplitude reflectors and depositional time lines are not always synonymous (Figure 2)? What is the value of quantifying and visualizing the physical forward model that produced complex salt tectonics (Figure 3)? What is the value of very rapid acquisition of topographic data and mapping with sub-meter vertical accuracy (Figure 4)? What is the value of 3-D visualization and of the virtual reality presentation of data to landowners in South Texas (Figure 5)? What is the value of mapping the salinization variations of soil and ground water around oil fields using a very rapid-acquisition airborne electromagnetic device (Figure 6)? What is the value of immediate access to 1.5 million boxes of cores and cuttings (Figure 7)? 

Most industries recognize the importance of technology and innovation (Figure 8) as a source of superior shareholder returns (Figure 9), as leverage in partnership negotiations, in differentiating themselves from competitors, and as a source of long-term corporate value. It is, therefore, somewhat of a paradox that oil company research and development (R&D) expenditures have been steadily decreasing for a decade (Figure 10). Part of the explanation for this decrease in R&D can be found in the increase in joint industry projects (JIP's) over the past decade (Figure 10). Increased collaboration can help the bottom line from a short-term cost perspective but may hurt it from a longer-term value perspective.

tAbstract

tFigure Captions (1-10)

tIntroduction

tThe Value of Research

tFigure Captions (11-25)

tProduction as a Metric for Research Value

     tOil

     tPrevious HitNaturalNext Hit Previous HitGasNext Hit

tFigure Captions (26-28)

tMeeting Future U.S. Energy Demand

     tProduction

     tImports

tEnergy Research

tSummary

tReferences

Figure Captions--Production as a Metric for Research Value

Figure 11: Major energy consumption throughout U.S. history.


Figure 12: Energy supplies in the United States in 1999.


Figure 13: Oil production decline on University of Texas lands in West Texas.


Figure 14: Oil production decline on University of Texas lands in West Texas versus price of West Texas Intermediate (WTI) crude oil.


Figure 15: Oil production decline on University of Texas lands in West Texas versus State of Texas oil production.


Figure 16: Oil production decline on University of Texas lands in West Texas with BEG reservoir characterization programs timing indicated. 


Figure 17: Theoretical production curve based on multiple successive reservoir characterization programs.


Figure 18: Oil production in the United States since 1949 with a theoretical oil production increase from application of advanced reservoir characterization.

Figure 19: U.S. Previous HitnaturalNext Hit Previous HitgasNext Hit use through time.


Figure 20: Previous HitNaturalNext Hit Previous HitgasNext Hit imports through time.


Figure 21: U.S. Previous HitnaturalNext Hit Previous HitgasNext Hit import and export picture.


Figure 22: Previous HitNaturalNext Hit Previous HitgasNext Hit production in the United States since 1949, showing the major components of the Previous HitnaturalNext Hit Previous HitgasNext Hit production curve.


Figure 23: Tight gas production in the United States showing Previous HitnaturalNext Hit Previous HitgasNext Hit response as a function of DOE and GRI investment in research and State and Federal production incentives.

Figure 24: Shale gas production in the United States showing Previous HitnaturalNext Hit Previous HitgasNext Hit response as a function of DOE and GRI investment in research.


Figure 25: Coalbed methane production in the United States showing Previous HitnaturalNext Hit Previous HitgasNext Hit response as a function of DOE and GRI investment in research and Federal production incentives.

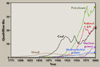
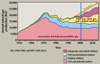
Production as a Metric for Research Value

Until the late 1800's, wood was the primary source of energy in the United States 
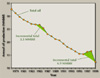
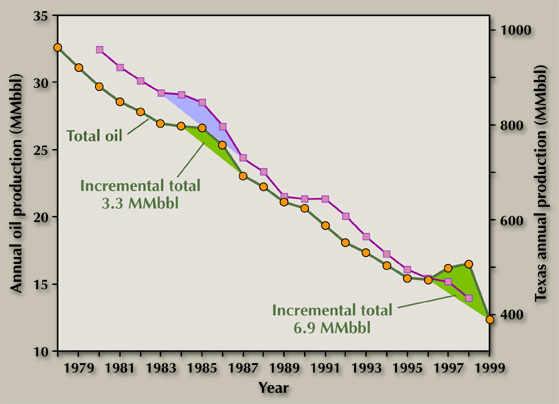
(Figure 11). Coal became an important energy source in the late 1800's and dominated the energy scene until the mid-1920's, when oil and gas became an important alternative to coal. By 1950, oil and Previous HitnaturalNext Hit Previous HitgasNext Hit combined had surpassed coal in terms of energy consumption, and they have dominated the energy consumption scene ever since. Today, with the exception of nuclear power, demand for every major source of energy in the United States is increasing. In terms of supply, coal is still the largest source of energy produced in the United States, followed by Previous HitnaturalNext Hit Previous HitgasNext Hit and crude oil (Figure 12). 

Oil

The University of Texas owns oil and gas royalty rights to approximately 2.1 million acres in the Permian Basin of West Texas. Oil production from these lands has been steadily decreasing for the past two decades (Figure 13). There are two "humps" in the oil production decline, one in the mid-1980's and one in the late 1990's, that combined represent more than 10 million barrels of incremental oil (production above the decline). What was the cause of the two humps? 

One possibility is that the humps are related to exploration and development driven by oil price. However, oil price data indicate that the 1980's hump occurred during a price fall, the 1990's hump occurred during a price rise, and there was a complete price cycle in the mid-1990's that had no impact on University Lands oil production (Figure 14).

Another possibility is that University Lands oil production is related to larger scale production cycles, driven by a complex set of global economic factors. One proxy for these larger scale cycles is oil production from all of Texas. In fact, the mid-1980's oil hump on University Lands does mirror the oil production in Texas, both falling in 1986 with the global price decline (Figure 15). However, the 1990's hump on University Lands occurred when Texas oil production did very little, and there is a hump in Texas oil production in the mid-1990's related to the oil price cycle (Figure 14) that has no University Lands equivalent. 
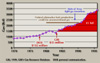
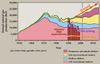
The Bureau of Economic Geology, funded in part by The University of Texas System, performed two sets of studies on University Lands reservoirs, one that began in the mid-1980's and one that began in the late 1990's (Figure 16). Often in partnership with operators, 11 fields were characterized in the mid-1980's study, and 5 fields in the late 1990's study. Incremental production from these 16 fields accounts for nearly half of the 10 million barrels of incremental oil represented by the two humps. Part of the remainder can be attributed to "copy-cat" programs implemented by operators in similar fields. A $3 million investment in research and technology by the royalty owner, and a multi-million-dollar investment in field development by operators, resulted in 10 million incremental barrels of oil. 
The study of multiple fields, coordinated with an operational improvement effort, resulted in incremental production and a positive economic benefit. The ideal program would shingle these production humps, resulting in a long-term improvement in production decline (Figure 17). The impact of this type of program on all U.S. oil production (Figure 18) would result in more than 6 billion barrels of incremental oil over the next 15 years.

Previous HitNaturalNext Hit Previous HitGasNext Hit

Previous HitNaturalNext Hit Previous HitgasNext Hit production in the United States was able to keep pace with consumption until the mid-1980's (Figure 19). Previous HitNaturalNext Hit Previous HitgasNext Hit imports have risen from around 4% in the mid-1980's to more than 15% today (Figure 20). More than 3 Tcf of gas was imported in 2000, and that number is not anticipated to decrease. A large percentage of the U.S. imported pipeline Previous HitnaturalNext Hit Previous HitgasNext Hit comes from Canada. Liquefied Previous HitnaturalNext Hit Previous HitgasNext Hit (LNG), largely from Algeria and Trinidad (Figure 21), accounts for most of the remaining Previous HitnaturalNext Hit Previous HitgasNext Hit imports. 

Forecasts for annual U.S. Previous HitnaturalNext Hit Previous HitgasNext Hit production indicate Previous HitnaturalNext Hit Previous HitgasNext Hit supply will grow from 21 Tcf in 2001 to around 27 Tcf by 2015. Demand is projected to exceed 30 Tcf by 2015 (Figure 22). Whereas most of the U.S. Previous HitnaturalNext Hit Previous HitgasNext Hit to date has come from associated, high-permeability, and shallow offshore sources, around 50% of the produced Previous HitnaturalNext Hit Previous HitgasNext Hit in 2015 is forecast to come from deepwater, subsalt, and unconventional (tight gas, shale gas, and coalbed methane) sources. 

Analysis of historical Federal and State exploration incentive programs and Federal and private investment in unconventional Previous HitnaturalNext Hit Previous HitgasNext Hit research indicates that the supply curves benefited greatly from Previous HitnaturalNext Hit Previous HitgasNext Hit research and the successful application of technology. The tight gas production curve shows a large positive increase in slope in 1985 following $165 million of combined investment in research by the DOE and GRI (Figure 23). Studies were focused on advanced stimulation technology, the greater Green River Basin, and the Piceance Basin. Combined with Federal and State tight gas production incentives, and investments in exploration and production by private sector operators, these investments in research have produced 11 Tcf of incremental Previous HitnaturalNext Hit Previous HitgasNext Hit to date.

The shale gas production curve shows a large positive increase in slope also in 1985 following more than $90 million of investment in research by the DOE in the prior decade 
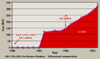
(Figure 24). Another surge in production from shale gas followed $6 million of additional investment by GRI beginning in 1990. Studies were focused on the Antrim shales and the Appalachian Basin shales. Combined with investments in exploration and production by private sector operators, these investments in research have produced more than 2 Tcf of incremental Previous HitnaturalNext Hit Previous HitgasNext Hit to date.

The coalbed methane production curve shows a large positive increase in slope in the late 1980's following $82 million of combined investment in research by the DOE and GRI in the preceding decade (Figure 25). Combined with Federal and State production incentives, and investments in exploration and production by private sector operators, these investments in research have produced nearly 5 Tcf of incremental Previous HitnaturalNext Hit Previous HitgasNext Hit to date, and show no evidence of slowing as coalbed methane expands its productive horizons to Texas. 

To summarize, Federal and State production incentives, combined with tight gas, shale gas, and coalbed methane research, funded largely by the U.S. Department of Energy (DOE: $240 million over 25 years), the Gas Research Institute (GRI: $140 million over 20 years), and the private energy sector, resulted in nearly 18 Tcf of incremental gas production from 1970 through 2000. Investment in research had a positive economic value.

Back to Top

tAbstract

tFigure Captions (1-10)

tIntroduction

tThe Value of Research

tFigure Captions (11-25)

tProduction as a Metric for Research Value

     tOil

     tPrevious HitNaturalNext Hit Previous HitGasNext Hit

tFigure Captions (26-28)

tMeeting Future U.S. Energy Demand

     tProduction

     tImports

tEnergy Research

tSummary

tReferences

Figure Captions--Meeting Future U.S. Energy Demand & Energy Research

Figure 26: U.S. Previous HitnaturalNext Hit Previous HitgasNext Hit production curve from Figure 22, superimposed with Texas and offshore Previous HitnaturalNext Hit Previous HitgasNext Hit production, and Texas and offshore Previous HitnaturalNext Hit Previous HitgasNext Hit production component forecasts.

Figure 27: U.S. Previous HitnaturalNext Hit Previous HitgasNext Hit production curve from Figure 22, superimposed with decreasing GRI, decreasing private sector, and flat DOE investment in Previous HitnaturalNext Hit Previous HitgasNext Hit research shown in sharp contrast to increasing demand.

Figure 28: History of the Standard Oil companies.

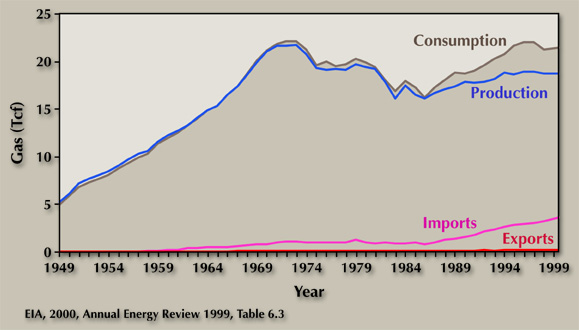
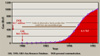
Meeting Future U.S. Energy Demand

Production

Oil imports have exceeded U.S. domestic oil production since 1994, and the ratio of imported to produced oil will grow in the future. However, the world is moving progressively away from heavy carbon energy such as coal and oil to cleaner fuels such as Previous HitnaturalNext Hit Previous HitgasNext Hit and hydrogen. This is good news for the environment but will place a tremendous burden on the supply of Previous HitnaturalNext Hit Previous HitgasNext Hit in the United States. 
To meet expected demand, the United States must replace and grow existing Previous HitnaturalNext Hit Previous HitgasNext Hit reserves by nearly 50% over the next 15 years (Figure 22). Much of that growth is forecast to come from unconventional and deepwater Previous HitnaturalNext Hit Previous HitgasNext Hit. Approximately 60% of the Previous HitnaturalNext Hit Previous HitgasNext Hit produced in the United States historically has come from Texas and the offshore Gulf of Mexico, and will likely remain at 60% or greater in the future (Figure 26). 
As history has shown, increasing the Previous HitnaturalNext Hit Previous HitgasNext Hit production curve will require a significant investment in Previous HitnaturalNext Hit Previous HitgasNext Hit research and application of new technology. Reserve replacement will come from continued production of conventional and shallow-water Previous HitnaturalNext Hit Previous HitgasNext Hit and be the primary responsibility of independent producers. Reserve growth will come from unconventional and deepwater sources and will be the primary responsibility of the major oil companies. With continued investment, shale gas, coal gas, and tight gas will supply a part of the future U.S. Previous HitnaturalNext Hit Previous HitgasNext Hit demand, but it will not be enough. Additional sources of Previous HitnaturalNext Hit Previous HitgasNext Hit such as deep onshore (>15,000 feet) and methane hydrates could provide significant new reserves, but will require significant government investment in research as well as private investment in exploration and production.

Imports

Part of the U.S. Previous HitnaturalNext Hit Previous HitgasNext Hit supply will continue to be satisfied by imported Previous HitnaturalNext Hit Previous HitgasNext Hit from Canada. Although Mexico currently consumes an order of magnitude less Previous HitnaturalNext Hit Previous HitgasNext Hit than the United States (<2 Tcf vs. >21 Tcf), demand for Previous HitnaturalNext Hit Previous HitgasNext Hit in Mexico is forecast to increase considerably over the next decade. Several of the Gulf onshore basins in Mexico, including Burgos, Veracruz, and Macuspana, and the underexplored Mexico offshore have high Previous HitnaturalNext Hit Previous HitgasNext Hit potential. However, because demand for Previous HitnaturalNext Hit Previous HitgasNext Hit within Mexico is growing dramatically, it is unlikely that Mexico will become a net exporter of Previous HitnaturalNext Hit Previous HitgasNext Hit to the United States in the short or mid term. To fill the demand gap, imported LNG must continue to rise over the next decade.

Energy Research

The United States is facing a very real energy problem. For the past century, the people of the United States have enjoyed, and actually come to expect, very inexpensive fossil energy. This cheap energy is the direct result of a century of technological advancements developed by the private energy industry, with limited Federal support. Inexpensive fossil energy has allowed the United States to become the most technologically advanced, wealthiest nation on Earth. During this time of cheap energy, the general public has come to believe that Federal support of energy research is a form of "corporate welfare." This idea is absurd.

In fact, just the opposite is true: the United States has been on "energy research welfare" provided by the private sector for nearly a century. The major oil companies, who have been serving up the energy research "soup," have all but closed the soup lines. The private energy sector has nearly eliminated the once-great private research and development laboratories, and R&D expenditures are half of what they were a decade ago (Figure 27). This is in part because of increased collaboration (Figure 10) and in part because there are fewer companies than there were 10 years ago. John Rockefeller must be smiling (Figure 28)! GRI, now called GTI, is no longer passing through funds for Previous HitnaturalNext Hit Previous HitgasNext Hit E&P research, and the Department of Energy is funding limited gas research externally and internally at the National Energy Technology Laboratory (NETL), but not at levels necessary to support future reserve replacement and reserve growth needs.

The mega-merger frenzy has resulted in several market realities. There has been a significant reduction in earth scientists and petroleum engineers over the past decade, resulting in very "lean" technical staff within each company. Graduate students in universities have recognized this shrinking job market and are now choosing other disciplines. Finally, there has been an extreme divergence in "economic class" between the super-majors and everyone else, which is unhealthy for the long-term survival of the industry.

The American people must make a decision regarding fossil energy: Either invest in energy research with Federal funding, including DOE and NSF, results of which would support the independent producers in the country so that growing Previous HitnaturalNext Hit Previous HitgasNext Hit demand can be meet with U.S. supply, or do not invest, and become dependent upon foreign sources of Previous HitnaturalNext Hit Previous HitgasNext Hit, just as we have with oil. 

In addition to Federal investment in fossil energy research, the private sector also has a choice: proact or react. I recommend a proactive position and the establishment of a Private Energy Research Foundation (PERF), modified after the Brazilian and French approaches to funding energy research. 

Key elements of PERF:
* It would be funded by a self-imposed tax on gross production, for example 0.5%.
* It would be composed of a committee of representatives from contributing corporations.
* It would evaluate competitive energy research proposals from U.S. universities and research organizations. 
* Grants would be awarded from a portion of annual PERF earnings. 

Key benefits of PERF:
* Participation would be self-imposed, not Federally mandated and regulated.
* Government matching could follow.
* Industry maintains control, and helps to ward off Government mandates. 
* Industry targets research dollars toward projects of high interest.
* It illustrates commitment to research and sends a positive signal to universities and students.

Summary

Research and the creative application of technology helped build the oil and Previous HitnaturalNext Hit Previous HitgasNext Hit production curves in the United States. Research and technology will grow the Previous HitnaturalNext Hit Previous HitgasNext Hit production and slow the oil production decline in the future. Research and applied technology have long-term value that is significantly greater than the initial investment. 

The United States has an energy problem. The American public must recognize the positive safety and environmental record the oil industry has built in the past 10 years, and they must get behind Federal support of fossil energy research if we are to avoid dependence on foreign sources of Previous HitnaturalNext Hit Previous HitgasTop. The private sector can be proactive by creating a Private Energy Research Foundation (PERF) to help fund vital energy research.

References

Energy Information Administration, 2000, Annual Energy Review 1999.

Energy Information Administration, 2000, National Gas Monthly, August 2000.

Kim, E. M., Tinker, S. W., Fisher, W. L., and Ruppel, S. C., 2000, Benefit/cost analysis of GRI's gas supply research initiative: economics of a gas supply research trust fund to increase gas production of Federal lands: The University of Texas at Austin, Bureau of Economic Geology, final report prepared for Gas Research Institute, 70 p.

Back to Top