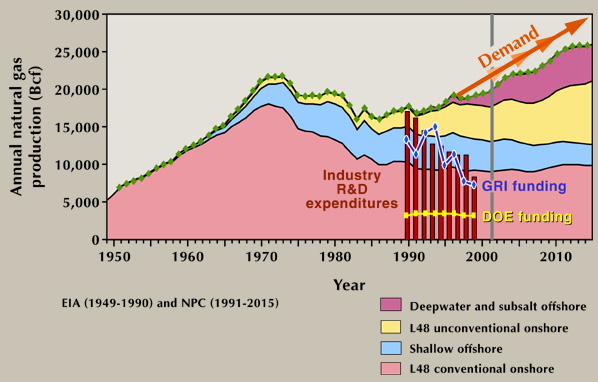
Figure 27: U.S. natural gas production curve from Figure 22, superimposed with decreasing GRI, decreasing private sector, and flat DOE investment in natural gas research shown in sharp contrast to increasing demand.
Figure 27: U.S. natural gas production curve from Figure 22, superimposed with decreasing GRI, decreasing private sector, and flat DOE investment in natural gas research shown in sharp contrast to increasing demand.