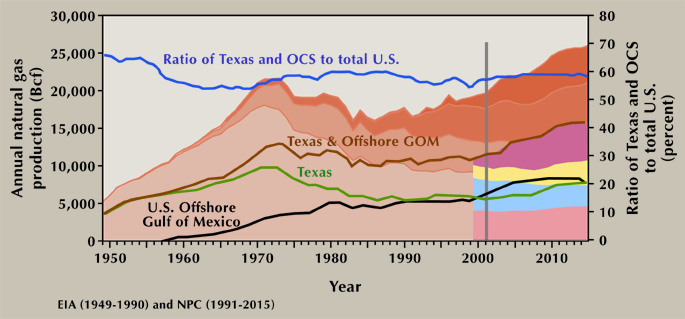
Figure 26: U.S. natural gas production curve from Figure 22, superimposed with Texas and offshore natural gas production, and Texas and offshore natural gas production component forecasts.
Figure 26: U.S. natural gas production curve from Figure 22, superimposed with Texas and offshore natural gas production, and Texas and offshore natural gas production component forecasts.