Estimating Pore Throat Size in Sandstones from Routine Core-Analysis Data
Edward D. Pittman
Search and Discovery Article #40009 (2001)
Adaptation for online presentation of article entitled “Relationship of
Porosity and Permeability to Various Parameters Derived from ![]() Mercury
Mercury![]()
![]() Injection
Injection![]() -Capillary
-Capillary ![]() Pressure
Pressure![]() Curves for Sandstone” by the same author in AAPG
Bulletin, V. 76 , 1992, p. 191-198.
Curves for Sandstone” by the same author in AAPG
Bulletin, V. 76 , 1992, p. 191-198.
Pore aperture size estimated from ![]() mercury
mercury![]()
![]() injection
injection![]() tests has been used to
evaluate seals for traps and to explain the locations of stratigraphic
hydrocarbon accumulations. However,
tests has been used to
evaluate seals for traps and to explain the locations of stratigraphic
hydrocarbon accumulations. However, ![]() mercury
mercury![]()
![]() injection
injection![]() tests are expensive and
therefore not abundant. This paper develops empirical equations for estimating
certain pore aperture size parameters from routine core analysis. The
relationship of porosity, uncorrected air permeability, and various parameters
derived from
tests are expensive and
therefore not abundant. This paper develops empirical equations for estimating
certain pore aperture size parameters from routine core analysis. The
relationship of porosity, uncorrected air permeability, and various parameters
derived from ![]() mercury
mercury![]()
![]() injection
injection![]() -capillary
-capillary ![]() pressure
pressure![]() curves was established
curves was established ![]() using
using![]() multiple regression on a database of 202 samples of sandstone from 14 formations
that range in age from Ordovician to Tertiary. These sandstone formations vary
in composition and texture.
multiple regression on a database of 202 samples of sandstone from 14 formations
that range in age from Ordovician to Tertiary. These sandstone formations vary
in composition and texture.
A series of empirically derived equations also permits the calculation of
pore aperture radii corresponding to ![]() mercury
mercury![]() saturation values that range from
10 to 75% in increments of five. This makes it possible to construct a
calculated pore aperture radius distribution curve
saturation values that range from
10 to 75% in increments of five. This makes it possible to construct a
calculated pore aperture radius distribution curve ![]() using
using![]() porosity and
permeability from core analysis.
porosity and
permeability from core analysis.
 Figure 1. Presentation of
 ![]() mercury
mercury![]()
![]() injection
injection![]() -capillary
-capillary ![]() pressure
pressure![]() data. Often this is presented as a semilog plot.
The threshold
data. Often this is presented as a semilog plot.
The threshold ![]() pressure
pressure![]() , as defined graphically by Katz and Thompson (1987),
corresponds to the inflection point at which the curve becomes convex upward.
The
, as defined graphically by Katz and Thompson (1987),
corresponds to the inflection point at which the curve becomes convex upward.
The ![]() displacement
displacement![]()
![]() pressure
pressure![]() (Pd) was defined by Schowalter (1979) as
the
(Pd) was defined by Schowalter (1979) as
the ![]() pressure
pressure![]() at a
at a ![]() mercury
mercury![]() saturation of 10%.
saturation of 10%.
 Figure 2. A log-log hyperbolic plot of
 ![]() mercury
mercury![]()
![]() injection
injection![]() data following
Thomeer (1960) and Swanson (1981). Thomeer used the values of the asymptotes in
his mathematical description. The 45o-line is tangent to the
hyperbola at the apex. Some
data following
Thomeer (1960) and Swanson (1981). Thomeer used the values of the asymptotes in
his mathematical description. The 45o-line is tangent to the
hyperbola at the apex. Some ![]() mercury
mercury![]() curves have no apex.
curves have no apex.
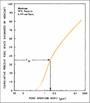 Figure 3. A semilog
 ![]() mercury
mercury![]()
![]() injection
injection![]() plot with pore size plotted on the
logarithmic axis.
plot with pore size plotted on the
logarithmic axis.
 Figure 4. A plot of Hg saturation/capillary
 ![]() pressure
pressure![]() versus Hg saturation, as
a means of determining the apex of Thomeer's (1960) hyperbola. This is a more
accurate method than the one depicted on Figure 2.
versus Hg saturation, as
a means of determining the apex of Thomeer's (1960) hyperbola. This is a more
accurate method than the one depicted on Figure 2.

 Figure 6. Comparison of measured (
![]() mercury
mercury![]()
![]() injection
injection![]() ) and calculated
(equations, Table 1) pore aperture radius distribution curves for the same
sample.
) and calculated
(equations, Table 1) pore aperture radius distribution curves for the same
sample.
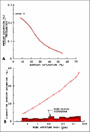 Figure 7. (A) Plot of
 ![]() mercury
mercury![]() saturation versus
saturation versus ![]() mercury
mercury![]() saturation divided by
saturation divided by
![]() pressure
pressure![]() , used to determine apex. If an apex exists for this sample, it must be
at a saturation of <10%. (B) Semilog plot of pore aperture radii versus
cumulative
, used to determine apex. If an apex exists for this sample, it must be
at a saturation of <10%. (B) Semilog plot of pore aperture radii versus
cumulative ![]() mercury
mercury![]() saturation.
saturation. ![]() Mercury
Mercury![]()
![]() injection
injection![]() data that do not have an apex
yield cumulative curves that are essentially straight or slightly concave
upward. The even distribution of pore radii on a histogram
data that do not have an apex
yield cumulative curves that are essentially straight or slightly concave
upward. The even distribution of pore radii on a histogram ![]() using
using![]() log2
classes indicates the lack of a dominant modal class or classes. If a modal
class exists, it is at a saturation of <10%; Wall Creek Sandstone, 13.8%
porosity and 1.1 md permeability.
log2
classes indicates the lack of a dominant modal class or classes. If a modal
class exists, it is at a saturation of <10%; Wall Creek Sandstone, 13.8%
porosity and 1.1 md permeability.
Click here to see slideshow and overlay of figures 7 and 8.
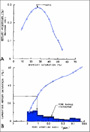 Figure 8. (A) Plot of
 ![]() mercury
mercury![]() saturation versus
saturation versus ![]() mercury
mercury![]() saturation divided by
saturation divided by
![]() pressure
pressure![]() , showing an apex at a saturation of 28%. (B) Semilog plot of pore
aperture radii versus cumulative
, showing an apex at a saturation of 28%. (B) Semilog plot of pore
aperture radii versus cumulative ![]() mercury
mercury![]() saturation. The corresponding histogram
(log[2] classes) has a modal pore aperture class between 1.41 and 1.0
micrometers and a weak secondary modal class from 0.125 to 0.088 micrometer. The
coarser mode corresponds to the apex, which is where the pores occur that are
capable of dominating flow; Terry Sandstone, 16.4% porosity and 1.8 md
permeability.
saturation. The corresponding histogram
(log[2] classes) has a modal pore aperture class between 1.41 and 1.0
micrometers and a weak secondary modal class from 0.125 to 0.088 micrometer. The
coarser mode corresponds to the apex, which is where the pores occur that are
capable of dominating flow; Terry Sandstone, 16.4% porosity and 1.8 md
permeability.
Click here to view overlay sequence of figures 7 and 8.
Table 1. Empirical Equations for Determining Pore Aperture Radii (mm)
Corresponding to Various ![]() Mercury
Mercury![]() Saturation Percentiles
Saturation Percentiles
Reservoir engineers and petrophysicists are interested in how permeability
and porosity relate to pore aperture size and pore aperture size distribution,
primarily so they can estimate permeability. Exploration geologists have been
interested in ![]() using
using![]() pore aperture size derived from
pore aperture size derived from ![]() mercury
mercury![]()
![]() injection
injection![]() data to
evaluate the sealing capacity of cap rocks (e.g., Smith, 1966; Berg, 1975). In a
water-saturated rock, hydrocarbon migration and entrapment result from the
opposing interplay of buoyancy
data to
evaluate the sealing capacity of cap rocks (e.g., Smith, 1966; Berg, 1975). In a
water-saturated rock, hydrocarbon migration and entrapment result from the
opposing interplay of buoyancy ![]() pressure
pressure![]() and capillary
and capillary ![]() pressure
pressure![]() . Following
expulsion from a source rock, hydrocarbons migrate through carrier beds when a
hydrocarbon filament has been established through the pores of the rock. If one
can determine the
. Following
expulsion from a source rock, hydrocarbons migrate through carrier beds when a
hydrocarbon filament has been established through the pores of the rock. If one
can determine the ![]() pressure
pressure![]() required to establish a connected hydrocarbon
filament through the largest interconnected water-saturated pore throats, one
can calculate the vertical hydrocarbon column required to migrate hydrocarbons (Schowalter,
1979). This
required to establish a connected hydrocarbon
filament through the largest interconnected water-saturated pore throats, one
can calculate the vertical hydrocarbon column required to migrate hydrocarbons (Schowalter,
1979). This ![]() displacement
displacement![]()
![]() pressure
pressure![]() is important to hydrocarbon migration and
entrapment .
is important to hydrocarbon migration and
entrapment .
The pore aperture size that corresponds to ![]() displacement
displacement![]()
![]() pressure
pressure![]() can be
determined from a
can be
determined from a ![]() mercury
mercury![]()
![]() injection
injection![]() test. However, often, one may want to know
this information when
test. However, often, one may want to know
this information when ![]() mercury
mercury![]()
![]() injection
injection![]() tests are unavailable because of cost
considerations, lack of core, or insufficient core material (e.g., small chips
or thin slabs) to permit sampling. Therefore, a readily available estimation of
tests are unavailable because of cost
considerations, lack of core, or insufficient core material (e.g., small chips
or thin slabs) to permit sampling. Therefore, a readily available estimation of
![]() displacement
displacement![]()
![]() pressure
pressure![]() , from other data such as porosity and permeability, would
be helpful.
, from other data such as porosity and permeability, would
be helpful.
Another parameter of interest is the pore aperture that corresponds to the
apex of a hyperbola on a log-log ![]() mercury
mercury![]()
![]() injection
injection![]() plot. This parameter has the
potential for delineating stratigraphic traps in the same manner as the pore
aperture corresponding to the 35th percentile of a cumulative
plot. This parameter has the
potential for delineating stratigraphic traps in the same manner as the pore
aperture corresponding to the 35th percentile of a cumulative ![]() mercury
mercury![]() saturation
curve, which was developed by H. D. Winland, Amoco Production Company.
saturation
curve, which was developed by H. D. Winland, Amoco Production Company.
The purpose of this paper is to (1) review previous efforts to relate
permeability, porosity, and ![]() mercury
mercury![]()
![]() injection
injection![]() -capillary
-capillary ![]() pressure
pressure![]() data; (2)
present empirical relationships among porosity, uncorrected air permeability,
and the pore aperture size that corresponds to the
data; (2)
present empirical relationships among porosity, uncorrected air permeability,
and the pore aperture size that corresponds to the ![]() displacement
displacement![]()
![]() pressure
pressure![]() and the
apex of a hyperbola on a log-log
and the
apex of a hyperbola on a log-log ![]() mercury
mercury![]()
![]() injection
injection![]() plot; and (3) present
empirically derived equations that permit construction of a pore aperture radius
distribution curve
plot; and (3) present
empirically derived equations that permit construction of a pore aperture radius
distribution curve ![]() using
using![]() porosity and permeability data.
porosity and permeability data.
Washburn (1921) first suggested the use of ![]() mercury
mercury![]()
![]() injection
injection![]() as a laboratory
method for determining the pore aperture size distribution in porous rocks. The
Washburn equation can be expressed as:
as a laboratory
method for determining the pore aperture size distribution in porous rocks. The
Washburn equation can be expressed as:
Pc=-2 gcosq/r
(1)
where Pc = capillary ![]() pressure
pressure![]() (dynes/cm2), g
= surface tension of Hg (480 dynes/cm), q
= contact angle of
(dynes/cm2), g
= surface tension of Hg (480 dynes/cm), q
= contact angle of ![]() mercury
mercury![]() in air (140o), and r = radius of pore
aperture for a cylindrical pore. Thus, r (mm)=
107/Pc (psia).
in air (140o), and r = radius of pore
aperture for a cylindrical pore. Thus, r (mm)=
107/Pc (psia).
Van Brakel et al. (1981) discussed some of the problems of ![]() mercury
mercury![]() porosimetry. One source of error in
porosimetry. One source of error in ![]() measuring
measuring![]() rock porosity is that the pores
are not necessarily cylindrical. Purcell (1949) was instrumental in developing
rock porosity is that the pores
are not necessarily cylindrical. Purcell (1949) was instrumental in developing
![]() mercury
mercury![]()
![]() injection
injection![]() techniques, and equation 1 has been the basis of further work
by many authors. Capillary
techniques, and equation 1 has been the basis of further work
by many authors. Capillary ![]() pressure
pressure![]() versus
versus ![]() mercury
mercury![]() saturation commonly is
plotted on arithmetic or semilog plots (Figure 1), although the saturation scale
sometimes is reversed so that it increases from right to left.
saturation commonly is
plotted on arithmetic or semilog plots (Figure 1), although the saturation scale
sometimes is reversed so that it increases from right to left.
Entry ![]() pressure
pressure![]() ,
, ![]() displacement
displacement![]()
![]() pressure
pressure![]() , and threshold
, and threshold ![]() pressure
pressure![]() are terms
referring to the initial part of the
are terms
referring to the initial part of the ![]() mercury
mercury![]()
![]() injection
injection![]() curve. The entry
curve. The entry ![]() pressure
pressure![]() on a
on a ![]() mercury
mercury![]()
![]() injection
injection![]() -capillary
-capillary ![]() pressure
pressure![]() plot is the point on the curve where
the
plot is the point on the curve where
the ![]() mercury
mercury![]() first enters the pores of the rock. This point is indicative of the
largest pore aperture size (Robinson, 1966). This parameter often is vague and
difficult to determine because the sample size and surface irregularities of the
rock relative to pore geometry create a boundary condition that affects the
low-
first enters the pores of the rock. This point is indicative of the
largest pore aperture size (Robinson, 1966). This parameter often is vague and
difficult to determine because the sample size and surface irregularities of the
rock relative to pore geometry create a boundary condition that affects the
low-![]() mercury
mercury![]() saturation part of the curve. Schowalter (1979) recognized this
problem and pointed out that the important aspect for evaluating seals for traps
is to determine the
saturation part of the curve. Schowalter (1979) recognized this
problem and pointed out that the important aspect for evaluating seals for traps
is to determine the ![]() pressure
pressure![]() required to form a connecting filament of
nonwetting fluid th ough the largest connected pore apertures of the rock. He
measured this
required to form a connecting filament of
nonwetting fluid th ough the largest connected pore apertures of the rock. He
measured this ![]() pressure
pressure![]() by making electrical conductivity readings during
by making electrical conductivity readings during ![]() mercury
mercury![]()
![]() injection
injection![]() and found the
and found the ![]() mercury
mercury![]() saturation ranged from 4.5 to 17%. Schowalter
(1979) wanted a pragmatic approach to use on existing
saturation ranged from 4.5 to 17%. Schowalter
(1979) wanted a pragmatic approach to use on existing ![]() mercury
mercury![]()
![]() injection
injection![]() data
where electrical conductivity measurements were not available. Therefore, he
defined the term
data
where electrical conductivity measurements were not available. Therefore, he
defined the term ![]() displacement
displacement![]()
![]() pressure
pressure![]() as the
as the ![]() pressure
pressure![]() at 10%
at 10% ![]() mercury
mercury![]() saturation, for use in evaluation of hydrocarbon entrapment. Katz and Thompson
(1986, 1987) defined threshold
saturation, for use in evaluation of hydrocarbon entrapment. Katz and Thompson
(1986, 1987) defined threshold ![]() pressure
pressure![]() as the
as the ![]() pressure
pressure![]() at which
at which ![]() mercury
mercury![]() forms a
connected pathway across the sample. Katz and Thompson (1987) indicated that the
measured threshold
forms a
connected pathway across the sample. Katz and Thompson (1987) indicated that the
measured threshold ![]() pressure
pressure![]() corresponded graphically to the inflection point on
a
corresponded graphically to the inflection point on
a ![]() mercury
mercury![]()
![]() injection
injection![]() plot. On Figure 1, this is where the
plot. On Figure 1, this is where the ![]() mercury
mercury![]()
![]() injection
injection![]() curve
becomes convex upward.
curve
becomes convex upward.
Wood's metal, an alloy of bismuth that contains lead, tin, and cadmium and
has a melting point of 70oC, has been used by various workers as a
nonwetting medium for ![]() injection
injection![]() into pores of rocks. Dullien and Dhawan (1975)
showed that injecting
into pores of rocks. Dullien and Dhawan (1975)
showed that injecting ![]() mercury
mercury![]() and Wood's metal yielded similar
and Wood's metal yielded similar ![]() injection
injection![]() curves.
Molten Wood's metal can be cooled and crystallized at any desired
curves.
Molten Wood's metal can be cooled and crystallized at any desired ![]() injection
injection![]()
![]() pressure
pressure![]() . One can evaluate the nature of the pore geometry occupied by Wood's
metal
. One can evaluate the nature of the pore geometry occupied by Wood's
metal ![]() using
using![]() various techniques. Dullien and co-workers (e.g., Dullien and Dhawan,
1974) have used photographic methods employing quantitative stereology of Wood's
metal to characterize pores, which consist of a series of bulges and necks.
Dullien (1981) has compared pore size distributions derived from quantitative
stereology and
various techniques. Dullien and co-workers (e.g., Dullien and Dhawan,
1974) have used photographic methods employing quantitative stereology of Wood's
metal to characterize pores, which consist of a series of bulges and necks.
Dullien (1981) has compared pore size distributions derived from quantitative
stereology and ![]() mercury
mercury![]() porosimetry. The
porosimetry. The ![]() mercury
mercury![]()
![]() injection
injection![]() technique indicates a
greater quantity of small pores than does the quantitative stereology technique.
technique indicates a
greater quantity of small pores than does the quantitative stereology technique.
Swanson (1977) established the position on the ![]() mercury
mercury![]()
![]() injection
injection![]() curve that
represents a continuous, well-interconnected pore system through the rock. He
used a porosimeter with a heating coil and molten Wood's metal to illustrate
visually the distribution of the nonwetting phase at various pressures. After
having been injected at a low
curve that
represents a continuous, well-interconnected pore system through the rock. He
used a porosimeter with a heating coil and molten Wood's metal to illustrate
visually the distribution of the nonwetting phase at various pressures. After
having been injected at a low ![]() pressure
pressure![]() , the cooled and crystallized Wood's metal
had a spotty distribution in the rock. With increasing
, the cooled and crystallized Wood's metal
had a spotty distribution in the rock. With increasing ![]() injection
injection![]()
![]() pressure
pressure![]() , the
nonwetting phase entered smaller pore apertures and the volume of the Wood's
metal increased. Eventually, an
, the
nonwetting phase entered smaller pore apertures and the volume of the Wood's
metal increased. Eventually, an ![]() injection
injection![]()
![]() pressure
pressure![]() was reached whereby the
Wood's metal occupied pore sizes that effectively interconnected the total major
pore system that dominates fluid flow. Swanson (1977, p. 2498) noted that at
this point, "the
was reached whereby the
Wood's metal occupied pore sizes that effectively interconnected the total major
pore system that dominates fluid flow. Swanson (1977, p. 2498) noted that at
this point, "the ![]() mercury
mercury![]() saturation expressed as percent of bulk volume is
indicative of that portion of the space effectively contributing to fluid
flow." Swanson (1977) determined that on a
saturation expressed as percent of bulk volume is
indicative of that portion of the space effectively contributing to fluid
flow." Swanson (1977) determined that on a ![]() mercury
mercury![]()
![]() injection
injection![]() curve, this
point corresponded to the apex of the hyperbola of a log-log plot. In Figure 2,
the 45o-line is tangent to the hyperbola at the apex.
curve, this
point corresponded to the apex of the hyperbola of a log-log plot. In Figure 2,
the 45o-line is tangent to the hyperbola at the apex.
Thomeer (1960) developed a mathematical description of capillary ![]() pressure
pressure![]() and
and
![]() mercury
mercury![]() saturation, and first plotted
saturation, and first plotted ![]() mercury
mercury![]()
![]() injection
injection![]() data as a log-log plot.
This plot yields a curve that approximates a hyperbola (Figure 2). The location
of the hyperbola with respect to the x and y axes is defined by the position of
the two asymptotes. Thomeer called these the extrapolated
data as a log-log plot.
This plot yields a curve that approximates a hyperbola (Figure 2). The location
of the hyperbola with respect to the x and y axes is defined by the position of
the two asymptotes. Thomeer called these the extrapolated ![]() displacement
displacement![]()
![]() pressure
pressure![]() (Pd on the y axis) and the bulk volume occupied by
(Pd on the y axis) and the bulk volume occupied by ![]() mercury
mercury![]() at
infinite
at
infinite ![]() pressure
pressure![]() (VbP[infinity] on the x axis). The shape of the
hyperbola is related to pore geometry, which leads to Thomeer's pore geometrical
factor (G). G is based on the possibility of a family of hyperbolic curves
having G values from zero to 10, with low values constituting larger and
better-sorted pore apertures and h nce indicating better reservoir
characteristics. Not all curves, however, are hyperbolic and suitable for
assignment of G values. Thomeer (1960) showed graphically that a relationship
exists among air permeability, (Vb)P[infinity]/ Pd, and G,
and that pore geometry affects permeability and
(VbP[infinity] on the x axis). The shape of the
hyperbola is related to pore geometry, which leads to Thomeer's pore geometrical
factor (G). G is based on the possibility of a family of hyperbolic curves
having G values from zero to 10, with low values constituting larger and
better-sorted pore apertures and h nce indicating better reservoir
characteristics. Not all curves, however, are hyperbolic and suitable for
assignment of G values. Thomeer (1960) showed graphically that a relationship
exists among air permeability, (Vb)P[infinity]/ Pd, and G,
and that pore geometry affects permeability and ![]() mercury
mercury![]()
![]() injection
injection![]() .
.
Swanson (1981) developed the following relationship based on 319 clean sandstone and carbonate samples:
Kair = 339(SHG/Pc)apex 1.691 (2)
where Kair is air permeability (md), SHG is the bulk
volume ![]() mercury
mercury![]() saturation (%), and Pc is capillary
saturation (%), and Pc is capillary ![]() pressure
pressure![]() (psi)
corresponding to the apex of a hyperbolic log-log
(psi)
corresponding to the apex of a hyperbolic log-log ![]() mercury
mercury![]()
![]() injection
injection![]() plot. This
equation for Kair has a standard deviation of 1.96x. Swanson also
showed a similar relationship for brine permeability (md) at 1000 psi effective
stress. This relationship was based on 56 clean sandstone and carbonate samples:
plot. This
equation for Kair has a standard deviation of 1.96x. Swanson also
showed a similar relationship for brine permeability (md) at 1000 psi effective
stress. This relationship was based on 56 clean sandstone and carbonate samples:
Kbrine = 355 (SHG / Pc)[apex] {2.005} (3)
which had an improved standard deviation of 1.67x. The advantage of ![]() using
using![]() stressed liquid permeability is that overburden
stressed liquid permeability is that overburden ![]() pressure
pressure![]() and the gas slippage
effect are taken into account. Swanson (1981) showed the relationship between
stressed brine permeability and unstressed air permeability to be
and the gas slippage
effect are taken into account. Swanson (1981) showed the relationship between
stressed brine permeability and unstressed air permeability to be
Kbrine = 0.292Kair 1.186 (4)
Swanson (1981) also developed a nomograph based on equation 3, which uses the
apex of the hyperbola of a log-log plot such as Figure 2. This nomograph permits
direct estimation of brine permeability from ![]() mercury
mercury![]()
![]() injection
injection![]() data.
data.
Swanson (1981) showed that the apex was the same for core plug data and
simulated drill cuttings (i.e., crushed rock from sample adjacent to the plug).
This suggests that useful ![]() mercury
mercury![]()
![]() injection
injection![]() data might be obtained from drill
cuttings. Other workers also have expressed the opinion that useful
data might be obtained from drill
cuttings. Other workers also have expressed the opinion that useful ![]() mercury
mercury![]()
![]() injection
injection![]() tests could be run on drill cuttings (Purcell, 1949; Ghosh et al.,
1987).
tests could be run on drill cuttings (Purcell, 1949; Ghosh et al.,
1987).
Katz and Thompson (1986, 1987) reported the following relationship:
K = 1/226 (lc 2} (s/so) (5)
where K = air permeability (md), lc = characteristic pore size
(i.e., the calculated pore size {micrometers} for threshold ![]() pressure
pressure![]() at which
at which
![]() mercury
mercury![]() forms a connected pathway through the sample), and (s/so
= ratio of rock conductivity to conductivity of formation water.
forms a connected pathway through the sample), and (s/so
= ratio of rock conductivity to conductivity of formation water.
This equation follows percolation theory arguments (e.g., Ambegaokar et al.,
1971), which are applicable to systems characterized by a broad distribution of
conductances with only short-range correlations. Seeburger and Nur (1984) showed
that the pore spaces of many reservoir rocks have a random, broad distribution
of pore sizes, which suggests that transport through pores must be understood in
terms of a broad distribution of local conductances (Katz and Thompson, 1987).
Equation 5 is applicable to sandstones and carbonates and appears to provide a
good estimate of permeability (Thompson et al., 1987). This approach, however,
requires a rock sample, laboratory measurement of threshold ![]() pressure
pressure![]() , and
measurement of rock and formation water conductivity.
, and
measurement of rock and formation water conductivity.
Yuan and Swanson (1989) used a method of rate-controlled ![]() mercury
mercury![]() porosimetry
in which the
porosimetry
in which the ![]() injection
injection![]() rate is kept constant and the
rate is kept constant and the ![]() mercury
mercury![]()
![]() pressure
pressure![]() is
monitored. Fluctuations in the
is
monitored. Fluctuations in the ![]() mercury
mercury![]() meniscus may occur because of varying
degrees of constriction along the flow path. This enabled the researchers to
resolve the pore space of a rock into pore bodies and pore throats. This
technique appears promising for improving our understanding of pore geometry.
meniscus may occur because of varying
degrees of constriction along the flow path. This enabled the researchers to
resolve the pore space of a rock into pore bodies and pore throats. This
technique appears promising for improving our understanding of pore geometry.
H. D. Winland (Amoco Production Company), who was interested in sealing
potential, developed an empirical relationship among porosity, air permeability,
and the pore aperture corresponding to a ![]() mercury
mercury![]() saturation of 35% (r35)
for a mixed suite of sandstones and carbonates. Winland ran regressions for
other percentiles (30, 40, and 50), but the best correlation (highest R) was the
35th percentile. No explanation was given for why the 35th percentile gave the
best correlation. His data set included 82 samples (56 sandstone and 26
carbonate) with low permeabilities that were corrected for gas slippage and 240
other samples with uncorrected permeabilities. The Winland equation was used and
published by Kolodzie (1980):
saturation of 35% (r35)
for a mixed suite of sandstones and carbonates. Winland ran regressions for
other percentiles (30, 40, and 50), but the best correlation (highest R) was the
35th percentile. No explanation was given for why the 35th percentile gave the
best correlation. His data set included 82 samples (56 sandstone and 26
carbonate) with low permeabilities that were corrected for gas slippage and 240
other samples with uncorrected permeabilities. The Winland equation was used and
published by Kolodzie (1980):
Log r35 = 0.732 + 0.588 Log Kair - 0.864 Log f (6)
where r35 is the pore aperture radius corresponding to the 35th percentile, Kair is uncorrected air permeability (md), and q is porosity (%).
Hartmann and Coalson (1990) correlated Winland's r35 values with
pore type and reservoir quality. Winland favored plotting cumulative percent
![]() mercury
mercury![]() saturation versus pore aperture radii on semilog paper, putting pore
aperture radii on the log scale (Figure 3).
saturation versus pore aperture radii on semilog paper, putting pore
aperture radii on the log scale (Figure 3).
Winland also showed, through several field examples, that r35
could be used to delineate commercial hydrocarbon accumulations of stratigraphic
traps. One of Winland's examples was the Terry Sandstone at Spindle Field,
Colorado. Pittman (1989), ![]() using
using![]() some of the same cored wells as Winland, showed
that the net feet of sandstone having an r35 greater than 0.5 mm
was useful for delineating the trap. Updip dry holes have no net sandstone with
an r35 >0.5 mm; whereas, a
good well in the field has 39 ft (11.9 m) of net sandstone with an r35
>0.5 mm.
some of the same cored wells as Winland, showed
that the net feet of sandstone having an r35 greater than 0.5 mm
was useful for delineating the trap. Updip dry holes have no net sandstone with
an r35 >0.5 mm; whereas, a
good well in the field has 39 ft (11.9 m) of net sandstone with an r35
>0.5 mm.
Two hundred and two porosity and uncorrected air permeability analyses were
available in the Amoco Research Center files on plugs that had also been used
for ![]() mercury
mercury![]()
![]() injection
injection![]() tests of sandstones from 14 formations. The porosities and
permeabilities of the data set ranged from 3.3 to 28.0% and 0.05 to 998 md,
respectively. These formations, which range in age from Ordovician to Tertiary,
include Simpson, Delaware, Tensleep, Nugget, Cotton Valley, Muddy, Mesaverde,
Terry, First Wall Creek, Second Wall Creek, Frontier, Montrose, Vicksburg, and
Frio sandstones. Lithologically, these sandstones include sublitharenites,
subarkoses, and quartz arenites in a modified Dott classification (Pettijohn et
al., 1987). Argillaceous sandstones, clean permeable sandstones, and clean but
tightly cemented sandstones are represented. The size of the sample suite
coupled with the wide range in porosity and permeability, the diverse
composition, and the variable texture of the sandstones suggests this should be
a representative sample set for reservoir sandstones.
tests of sandstones from 14 formations. The porosities and
permeabilities of the data set ranged from 3.3 to 28.0% and 0.05 to 998 md,
respectively. These formations, which range in age from Ordovician to Tertiary,
include Simpson, Delaware, Tensleep, Nugget, Cotton Valley, Muddy, Mesaverde,
Terry, First Wall Creek, Second Wall Creek, Frontier, Montrose, Vicksburg, and
Frio sandstones. Lithologically, these sandstones include sublitharenites,
subarkoses, and quartz arenites in a modified Dott classification (Pettijohn et
al., 1987). Argillaceous sandstones, clean permeable sandstones, and clean but
tightly cemented sandstones are represented. The size of the sample suite
coupled with the wide range in porosity and permeability, the diverse
composition, and the variable texture of the sandstones suggests this should be
a representative sample set for reservoir sandstones.
The threshold ![]() pressure
pressure![]() and
and ![]() displacement
displacement![]()
![]() pressure
pressure![]() were determined graphically
from the
were determined graphically
from the ![]() mercury
mercury![]()
![]() injection
injection![]() curves, and the corresponding pore aperture radii
were calculated
curves, and the corresponding pore aperture radii
were calculated ![]() using
using![]() equation 1. The apex was determined graphically for each
equation 1. The apex was determined graphically for each
![]() mercury
mercury![]()
![]() injection
injection![]() curve by plotting
curve by plotting ![]() mercury
mercury![]() saturation
saturation ![]() pressure
pressure![]() divided by
divided by
![]() mercury
mercury![]() saturation on the y axis against
saturation on the y axis against ![]() mercury
mercury![]() saturation on the x axis
(Figure 4). Six of the 202 samples were nonhyperbolic and lacked an apex. Pore
aperture radii corresponding to the 10th, 15th, 20th, 25th, 30th, 35th, 40th,
45th, 50th, 55th, 60th, 65th, 70th, and 75th percentiles of
saturation on the x axis
(Figure 4). Six of the 202 samples were nonhyperbolic and lacked an apex. Pore
aperture radii corresponding to the 10th, 15th, 20th, 25th, 30th, 35th, 40th,
45th, 50th, 55th, 60th, 65th, 70th, and 75th percentiles of ![]() mercury
mercury![]() saturation
were also determined. A Statistical Analysis System (SAS) multiple regression
program was used to establish various empirical relationships.
saturation
were also determined. A Statistical Analysis System (SAS) multiple regression
program was used to establish various empirical relationships.
The graphical expression of the threshold ![]() pressure
pressure![]() (Katz and Thompson, 1986),
which is the inflection point of the curve, was determined for all
(Katz and Thompson, 1986),
which is the inflection point of the curve, was determined for all ![]() mercury
mercury![]()
![]() injection
injection![]() curves. For some samples, the inflection point was vague and difficult
to determine.
curves. For some samples, the inflection point was vague and difficult
to determine. ![]() Using
Using![]() the radius of the pore aperture corresponding to the
threshold
the radius of the pore aperture corresponding to the
threshold ![]() pressure
pressure![]() (rthresh in micrometers) as the dependent variable
in a multiple regression involving uncorrected air permeability (K in md), and
porosity (f in %) yielded:
(rthresh in micrometers) as the dependent variable
in a multiple regression involving uncorrected air permeability (K in md), and
porosity (f in %) yielded:
Log rthresh = 0.137 + 0.479 Log K - 0.143 Log f. (7)
This equation has a correlation coefficient of 0.900.
A relationship among the pore size corresponding to Schowalter's (1979)
![]() displacement
displacement![]()
![]() pressure
pressure![]() (rPd in micrometers), uncorrected air
permeability (K in md), and porosity (phi in %), was established by a multiple
regression with log rPd as the dependent variable:
(rPd in micrometers), uncorrected air
permeability (K in md), and porosity (phi in %), was established by a multiple
regression with log rPd as the dependent variable:
Log rPd = 0.459 + 0.500 Log K - 0.385 Log f (8)
This equation has a correlation coefficient of 0.901.
Based on a multiple regression with log rapex as the dependent variable, the relationship among the pore size corresponding to the apex (rapex in micrometers), uncorrected air permeability (K in md), and porosity (f in %) is:
Log rapex = -0.117 + 0.475 Log K - 0.099 Log f (9)
This equation yields a correlation coefficient of 0.919. The porosity term is not statistically significant in this equation. A regression excluding porosity as a variable also has an R of 0.919 and yields:
Log rapex = -0.226 + 0.466 Log K (10)
where rapex is in micrometers and K is uncorrected air permeability in millidarcys.
A graph of log rapex calculated from equation 9 plotted against
graphically determined rapex (Figure 4) is shown in Figure 5. This
plot has a correlation coefficient of 0.931. The mean apex for the 196
sandstones had a ![]() mercury
mercury![]() saturation of 36%.
saturation of 36%.
Winland's approach of ![]() using
using![]() multiple regression analysis to develop an
empirical equation for calculating the pore throat that corresponds to the 35th
percentile was extended to a spread of
multiple regression analysis to develop an
empirical equation for calculating the pore throat that corresponds to the 35th
percentile was extended to a spread of ![]() mercury
mercury![]() saturation percentiles (Table 1).
For the lower percentiles of
saturation percentiles (Table 1).
For the lower percentiles of ![]() mercury
mercury![]() saturation (10-35), the porosity term is
not statistically significant and the pore aperture sizes could be predicted
equally well
saturation (10-35), the porosity term is
not statistically significant and the pore aperture sizes could be predicted
equally well ![]() using
using![]() only permeability in the regression to develop an equation.
The porosity term is statistically significant for the higher percentiles of
only permeability in the regression to develop an equation.
The porosity term is statistically significant for the higher percentiles of
![]() mercury
mercury![]() saturation (40-75). The reason for this is unknown. For simplicity,
however, all the empirical equations in Table 1 include a porosity term. In
Table 1, note that the correlation coefficient, R, decreases at increasingly
higher percentiles. One can construct a partial pore aperture size distribution
curve from the equations in Table 1, recognizing that the accuracy would
diminish above the 55th percentile. For most sandstones, this would cover the
important part of the curve. Regressions for pore apertures corresponding to
saturation (40-75). The reason for this is unknown. For simplicity,
however, all the empirical equations in Table 1 include a porosity term. In
Table 1, note that the correlation coefficient, R, decreases at increasingly
higher percentiles. One can construct a partial pore aperture size distribution
curve from the equations in Table 1, recognizing that the accuracy would
diminish above the 55th percentile. For most sandstones, this would cover the
important part of the curve. Regressions for pore apertures corresponding to
![]() mercury
mercury![]() saturation percentiles from 10 to 55% had R values above 0.900. Figure 6
shows measured (via
saturation percentiles from 10 to 55% had R values above 0.900. Figure 6
shows measured (via ![]() mercury
mercury![]()
![]() injection
injection![]() ) and calculated (equations, Table 1) pore
aperture radius distribution curves for the same sample.
) and calculated (equations, Table 1) pore
aperture radius distribution curves for the same sample.
![]() Using
Using![]() permeability as the dependent variable yielded the following empirical
relationships:
permeability as the dependent variable yielded the following empirical
relationships:
(a) Log K = -0.861 + 1.185 Log f + 1.627 Log rapex (11)
with an R of 0.928. In this equation, K is uncorrected air permeability (md), f is porosity (%), and rapex is the pore radius corresponding to the apex (mm).
(b) Log K = -1.221 + 1.415 Log f + 1.512 Log r25 (12)
yielded the best correlation coefficient, an R of 0.939. For equation 12, K
is uncorrected air permeability (md), f
is porosity (%), and r25 is the pore aperture corresponding to the
25th percentile of saturation on a cumulative ![]() mercury
mercury![]()
![]() injection
injection![]() plot.
plot.
Sediments deposited in an aqueous environment have an affinity for water and
are water-wet. After oil becomes trapped in a reservoir, polar organic compounds
may adhere to the rock surface and through time make the rock oil-wet or
partially oil-wet. However, for the purposes of migration and entrapment of
hydrocarbons, rocks are considered to be water-wet. Following generation and
expulsion of hydrocarbons from a source rock, the hydrocarbons move through a
carrier bed as a nonwetting phase displacing water. Eventually, the hydrocarbons
reach a position where the capillary ![]() pressure
pressure![]() exceeds the opposing buoyancy
exceeds the opposing buoyancy
![]() pressure
pressure![]() generated by the hydrocarbon column, and the hydrocarbons are trapped.
generated by the hydrocarbon column, and the hydrocarbons are trapped.
To evaluate migration and entrapment of hydrocarbons, it is necessary to
identify the pore aperture size that would lead to entrapment. Ideally, this
would be the threshold ![]() pressure
pressure![]() , as measured in the laboratory by Katz and
Thompson (1987), at which the
, as measured in the laboratory by Katz and
Thompson (1987), at which the ![]() mercury
mercury![]() provides an interconnecting thread across
the core plug to establish electrical conductivity. This approach, however,
precludes the use of existing
provides an interconnecting thread across
the core plug to establish electrical conductivity. This approach, however,
precludes the use of existing ![]() mercury
mercury![]()
![]() injection
injection![]() tests. If porosity and
permeability values from a core analysis are available, the pore aperture size
corresponding to the
tests. If porosity and
permeability values from a core analysis are available, the pore aperture size
corresponding to the ![]() displacement
displacement![]()
![]() pressure
pressure![]() can be predicted
can be predicted ![]() using
using![]() equation 8.
The threshold
equation 8.
The threshold ![]() pressure
pressure![]() as defined by Katz and Thompson (1986, 1987), would be
more accurate than the
as defined by Katz and Thompson (1986, 1987), would be
more accurate than the ![]() displacement
displacement![]()
![]() pressure
pressure![]() as defined by Schowalter (1979).
However, the graphical determination of threshold
as defined by Schowalter (1979).
However, the graphical determination of threshold ![]() pressure
pressure![]() , which is required
for working with existing "old" data, is inaccurate, and thus equation
7 does not appear to be an improvement over equation 8. Calculation of
, which is required
for working with existing "old" data, is inaccurate, and thus equation
7 does not appear to be an improvement over equation 8. Calculation of
![]() displacement
displacement![]()
![]() pressure
pressure![]() pore radii from porosity and permeability values has the
advantage of providing data throughout the cored interval instead of being
limited to results from sparse
pore radii from porosity and permeability values has the
advantage of providing data throughout the cored interval instead of being
limited to results from sparse ![]() mercury
mercury![]()
![]() injection
injection![]() tests.
tests.
Berg (1975) recognized the limitations of sparse ![]() mercury
mercury![]()
![]() injection
injection![]() test data.
He developed an empirical equation to estimate grain size from porosity and
permeability and then determined pore aperture radii by incorporating grain size
in another equation. He states that this method "gives only a crude
approximation of dominant pore size for natural sandstones" (Berg, 1975, p.
947). The empirical equations developed in this paper are an improvement over
the approach used by Berg because these equations do not require estimation of
grain size.
test data.
He developed an empirical equation to estimate grain size from porosity and
permeability and then determined pore aperture radii by incorporating grain size
in another equation. He states that this method "gives only a crude
approximation of dominant pore size for natural sandstones" (Berg, 1975, p.
947). The empirical equations developed in this paper are an improvement over
the approach used by Berg because these equations do not require estimation of
grain size.
The pore aperture corresponding to the apex of the hyperbola on a log-log
![]() mercury
mercury![]()
![]() injection
injection![]() plot is of significance because it represents the pore
apertures that interconnect to form what Swanson (1981) referred to as an
effective pore system that dominates flow. Six of the 202 samples (2.9%) were
nonhyperbolic and lacked an apex. These six samples ranged in porosity and
permeability from 8.8 to 20.0% and 0.09 to 3.0 md, respectively. The
permeability, however, was typically low (mean = 1.14 md). All of these samples
had
plot is of significance because it represents the pore
apertures that interconnect to form what Swanson (1981) referred to as an
effective pore system that dominates flow. Six of the 202 samples (2.9%) were
nonhyperbolic and lacked an apex. These six samples ranged in porosity and
permeability from 8.8 to 20.0% and 0.09 to 3.0 md, respectively. The
permeability, however, was typically low (mean = 1.14 md). All of these samples
had ![]() mercury
mercury![]()
![]() injection
injection![]() curves that yielded essentially straight or slightly
concave-upward curves when plotted on a semilog plot (e.g., Figure 7). Note that
this type of sample has no dominant modal pore aperture size class on the
histogram (Figure 7). If a dominant class and corresponding apex exist, that
class is probably in the <10%
curves that yielded essentially straight or slightly
concave-upward curves when plotted on a semilog plot (e.g., Figure 7). Note that
this type of sample has no dominant modal pore aperture size class on the
histogram (Figure 7). If a dominant class and corresponding apex exist, that
class is probably in the <10% ![]() mercury
mercury![]() saturation range. Samples with an apex
have
saturation range. Samples with an apex
have ![]() mercury
mercury![]()
![]() injection
injection![]() curve shapes that are co vex-upward through most of the
curve on a semilog plot (e.g., Figure 8). The apex corresponds to the dominant
pore aperture class on the histogram (Figure 8).
curve shapes that are co vex-upward through most of the
curve on a semilog plot (e.g., Figure 8). The apex corresponds to the dominant
pore aperture class on the histogram (Figure 8).
The mean ![]() mercury
mercury![]() saturation for the apex of Amoco's 196 sandstones was 36%,
which is very close to the 35% that Winland used to delineate hydrocarbon
accumulations in stratigraphic traps. Perhaps Winland found the best correlation
to be for r35 because that is where the average modal pore aperture
occurs and where the pore network is developed to the point of serving as an
effective pore system that dominates flow in the sense described by Swanson
(1981), based on his studies involving
saturation for the apex of Amoco's 196 sandstones was 36%,
which is very close to the 35% that Winland used to delineate hydrocarbon
accumulations in stratigraphic traps. Perhaps Winland found the best correlation
to be for r35 because that is where the average modal pore aperture
occurs and where the pore network is developed to the point of serving as an
effective pore system that dominates flow in the sense described by Swanson
(1981), based on his studies involving ![]() injection
injection![]() of Wood's metal.
of Wood's metal.
A limited test of the applicability of equation 9 for apex radii was made in
two wells previously studied in the Terry Sandstone stratigraphic trap at
Spindle Field (Pittman, 1989). Results showed a favorable comparison between
equation 9 and H. D. Winland's r35 (equation 6). An updip dry hole
had no net feet of sandstone having a pore aperture of >0.5 mm
![]() using
using![]() both equations. The calculated mean pore aperture size was 0.314 mm
for apex and 0.326 micrometer for r35. A producing well had 40 and 39
net ft (12.2 and 11.9 m) of sandstone having a pore aperture >0.5 mm,
respectively,
both equations. The calculated mean pore aperture size was 0.314 mm
for apex and 0.326 micrometer for r35. A producing well had 40 and 39
net ft (12.2 and 11.9 m) of sandstone having a pore aperture >0.5 mm,
respectively, ![]() using
using![]() apex and r35 equations. The calculated mean
aperture radius for this producing well was 0.741 mm
for apex and 0.671 mm for r35.
Thus, both equations appear to serve equally well for distinguishing
nonproductive from productive wells for this trap.
apex and r35 equations. The calculated mean
aperture radius for this producing well was 0.741 mm
for apex and 0.671 mm for r35.
Thus, both equations appear to serve equally well for distinguishing
nonproductive from productive wells for this trap.
Porosity and uncorrected air permeability from routine core analysis can be
used to estimate ![]() displacement
displacement![]()
![]() pressure
pressure![]() for use in the equations presented by
Schowalter (1979), and to estimate the pore aperture size of the apex for use in
delineating traps in a manner similar to the way r35 has been used.
for use in the equations presented by
Schowalter (1979), and to estimate the pore aperture size of the apex for use in
delineating traps in a manner similar to the way r35 has been used.
Among 196 sandstone samples from 14 formations, the mean apex of log-log
![]() mercury
mercury![]()
![]() injection
injection![]() plots was at a
plots was at a ![]() mercury
mercury![]() saturation of 36%. The empirically
derived relationships among uncorrected air permeability (K in md), porosity (f
in %), and the pore aperture radius (mm)
corresponding to the
saturation of 36%. The empirically
derived relationships among uncorrected air permeability (K in md), porosity (f
in %), and the pore aperture radius (mm)
corresponding to the ![]() displacement
displacement![]()
![]() pressure
pressure![]() and apex, respectively, can be
expressed as
and apex, respectively, can be
expressed as
Log rPd = 0.459 + 0.500 Log K - 0.385 Log f
And
Log rapex = -0.117 + 0.475 Log k - 0.099
Log f.
Because these equations are based on uncorrected air permeabilities, the use of corrected permeability values, which would be smaller, would produce a misleadingly smaller pore-aperture-size calculation.
The empirically derived equations of Table 1 correspond to ![]() mercury
mercury![]() saturations from 10 to 75%, and permit the construction of a calculated
pore-aperture-radius distribution curve that is based on porosity and
uncorrected air permeability.
saturations from 10 to 75%, and permit the construction of a calculated
pore-aperture-radius distribution curve that is based on porosity and
uncorrected air permeability.
Ambegaokar, V., B. I. Halperin, and J. S. Langer, 1971, Hopping conductivity in disordered systems: Physical Review B, v. 4, p. 2612-2620.
Berg, R. R., 1975, Capillary ![]() pressure
pressure![]() in stratigraphic traps: AAPG Bulletin,
v. 59, p. 939-956.
in stratigraphic traps: AAPG Bulletin,
v. 59, p. 939-956.
Dullien, F. A. L., 1981, Wood's metal porosimetry and its relation to ![]() mercury
mercury![]() porosimetry: Powder Technology, v. 29, p. 109-116.
porosimetry: Powder Technology, v. 29, p. 109-116.
Dullien, F. A. L., and G. K. Dhawan, 1974, Characterization of pore structure
by a combination of quantitative photomicrography and ![]() mercury
mercury![]() porosimetry:
Journal of Colloid and Interface Science, v. 47, p. 337-349.
porosimetry:
Journal of Colloid and Interface Science, v. 47, p. 337-349.
Dullien, F. A. L., and G. K. Dhawan, 1975, Bivariate pore-size distributions of some sandstones: Journal of Colloid and Interface Science, v. 53, p. 129-135.
Ghosh, S. K., S. F. Urschel, and G. M. Friedman, 1987, Substitution of simulated well-cuttings for core plugs in the petrophysical analysis of dolostones: Permian San Andres Formation, Texas: Carbonates and Evaporites, v. 2, p. 95-100.
Hartmann, D. J., and E. B. Coalson, 1990, Evaluation of the Morrow Sandstone in Sorrento Field, Cheyenne County, Colorado, in S. A. Sonnenberg, L. T. Shannon, K. Rader, W. F. Von Drehle, and G. W. Martin, eds., Morrow Sandstones of Southeast Colorado and Adjacent Areas, The Rocky Mountain Association of Geologists, Denver, Colorado, p. 91-100.
Katz, A. J., and A. H. Thompson, 1986, Quantitative prediction of permeability in porous rock: Physical Review B, v. 34, p. 8179-8181.
Katz, A. J., and A. H. Thompson, 1987, Prediction of rock electrical
conductivity from ![]() mercury
mercury![]()
![]() injection
injection![]() measurements: Journal of Geophysical
Research, v. 92, p. 599-607.
measurements: Journal of Geophysical
Research, v. 92, p. 599-607.
Kolodzie, S., Jr., 1980, Analysis of pore throat size and use of the Waxman-Smits equation to determine OOIP in Spindle Field, Colorado: Society of Petroleum Engineers, 55th Annual Fall Technical Conference, Paper SPE-9382, 10 p.
Pettijohn, F. J., P. E. Potter, and R. Siever, 1987, Sand and sandstones, 2d ed., New York, Springer-Verlag, 553 p.
Pittman, E. D., 1989, Nature of the Terry Sandstone reservoir, Spindle Field, Colorado, in E. B. Coalson, ed., Petrogenesis and Petrophysics of Selected Sandstone Reservoirs of the Rocky Mountain Region, Rocky Mountain Association of Geologists, Denver, Colorado, p. 245-254.
Purcell, W. R., 1949, Capillary pressures--their measurement ![]() using
using![]()
![]() mercury
mercury![]() and the calculation of permeability therefrom: American Institute of Mechanical
Engineers, Petroleum Transactions, Feb., p. 39-48.
and the calculation of permeability therefrom: American Institute of Mechanical
Engineers, Petroleum Transactions, Feb., p. 39-48.
Robinson, R. B., 1966, Classification of reservoir rocks by surface texture: AAPG Bulletin, v. 50, p. 547-559.
Schowalter, T. T., 1979, Mechanics of secondary hydrocarbon migration and entrapment: AAPG Bulletin, v. 63, p. 723-760.
Seeburger, D. A., and A. Nur, 1984, A pore space model for rock permeability and bulk modulus: Journal Geophysical Research, v. 89, no. B1, p. 527-536.
Smith, D. A., 1966, Theoretical considerations of sealing and non-sealing faults: AAPG Bulletin, v. 50, p. 363-374.
Swanson, B. F., 1977, Visualizing pores and non-wetting phase in porous rocks: Society of Petroleum Engineers, Annual Fall Technical Conference, SPE Paper 6857, 10 p.
Swanson, B. F., 1981, A simple correlation between permeabilities and ![]() mercury
mercury![]() capillary pressures: Journal of Petroleum Technology, Dec., p. 2488-2504.
capillary pressures: Journal of Petroleum Technology, Dec., p. 2488-2504.
Thomeer, J. H. M., 1960, Introduction of a pore geometrical factor defined by
the capillary ![]() pressure
pressure![]() curve: Journal Petroleum Technology, Mar., p. 73-77.
curve: Journal Petroleum Technology, Mar., p. 73-77.
Thompson, A. H., A. J. Katz, and R. A. Raschke, 1987, Estimation of absolute
permeability from capillary ![]() pressure
pressure![]() measurements: Society of Petroleum
Engineers, 62nd Annual Technical Conference, Paper SPE-16794, p. 475-481.
measurements: Society of Petroleum
Engineers, 62nd Annual Technical Conference, Paper SPE-16794, p. 475-481.
Van Brakel, J., S. Modry, and M. Svata, 1981, ![]() Mercury
Mercury![]() porosimetry: state of
the art: Powder Technology, v. 29, p. 1-12.
porosimetry: state of
the art: Powder Technology, v. 29, p. 1-12.
Washburn, E. W., 1921, Note on a method of determining the distribution of pore sizes in a porous material: Proceedings of the National Academy of Science, v. 7, p. 115-116.
Yuan, H. H., and B. F. Swanson, 1989, Resolving pore-space characteristics by rate-controlled porosimetry: SPE Formation Evaluation, March, p. 17-24.
Department of Geosciences, University of Tulsa, Tulsa, Oklahoma 74104 (at the time of publication in AAPG Bulletin); now Sedona, Arizona..
The statistical analyses were done while the author was employed by Amoco
Production Company ![]() using
using![]() data in the Research Center files. Unpublished work by
H. D. Winland, Amoco Production Company, provided the inspiration for this
paper. One hundred-three of the 202 samples were from the Winland sample suite.
I thank M. O. Traugott, D. R. Spain, and J. B. Thomas for their thoughtful and
helpful reviews of the manuscript.
data in the Research Center files. Unpublished work by
H. D. Winland, Amoco Production Company, provided the inspiration for this
paper. One hundred-three of the 202 samples were from the Winland sample suite.
I thank M. O. Traugott, D. R. Spain, and J. B. Thomas for their thoughtful and
helpful reviews of the manuscript.