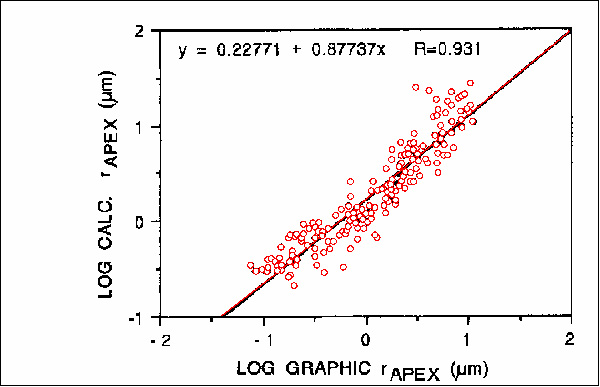
Figure 5. Plot of calculated pore aperture corresponding to the apex (equation 9) versus pore aperture of graphically derived apex (Figure 4).
Figure 5. Plot of calculated pore aperture corresponding to the apex (equation 9) versus pore aperture of graphically derived apex (Figure 4).