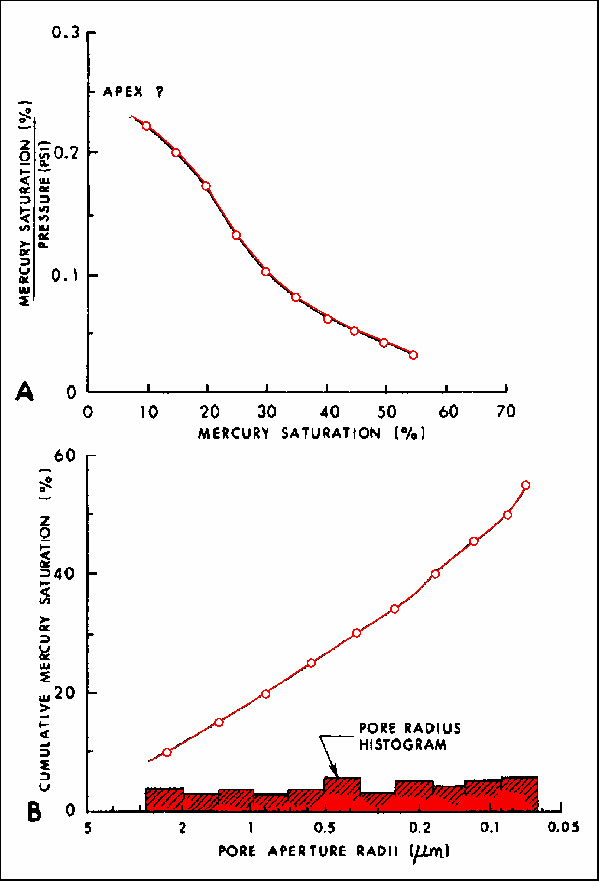
Figure 7. (A) Plot of mercury saturation versus mercury saturation divided by pressure, used to determine apex. If an apex exists for this sample, it must be at a saturation of <10%. (B) Semilog plot of pore aperture radii versus cumulative mercury saturation. Mercury injection data that do not have an apex yield cumulative curves that are essentially straight or slightly concave upward. The even distribution of pore radii on a histogram using log2 classes indicates the lack of a dominant modal class or classes. If a modal class exists, it is at a saturation of <10%; Wall Creek Sandstone, 13.8% porosity and 1.1 md permeability.