![]() Click to view this article in PDF format.
Click to view this article in PDF format.
3-D ![]() Seismic
Seismic![]() Images of the Effects of Carbonate Karst Collapse on Overlying
Stratigraphy*
Images of the Effects of Carbonate Karst Collapse on Overlying
Stratigraphy*
By
Bob A. Hardage1
Search and Discovery Article #40044 (2002)
*Adapted
for online presentation from two articles by the same author in AAPG Explorer
(October and November, 1998), respectively entitled “Collapse Effect Viewed” and
“![]() Seismic
Seismic![]() Supports Collapse Concept.” Appreciation is expressed to the author and
to M. Ray Thomasson, former Chairman of the AAPG Geophysical Integration
Committee, and Larry Nation, AAPG Communications Director, for their support of
this online version.
Supports Collapse Concept.” Appreciation is expressed to the author and
to M. Ray Thomasson, former Chairman of the AAPG Geophysical Integration
Committee, and Larry Nation, AAPG Communications Director, for their support of
this online version.
1Bureau of Economic Geology, The University of Texas at Austin ([email protected] ). Coauthors: David Carr, consulting geologist, Austin, Texas; D. Lancaster, S.A. Holditch and Associates, College Station, Texas; J. Simmons, Jr., Bureau of Economic Geology, The University of Texas at Austin; Virginia Pendleton, Integrity Geophysics, Tulsa, Oklahoma; Robert Elphick, Schlumberger, Denver, Colorado.
|
|
Click here to view
Click here to view
Click here to view
Click here to view
Click here to view
Click here to view
Click here to view
Click here to view
At Boonsville Field in the Fort Worth Basin, gas production occurs throughout the Bend Conglomerate interval, a Middle Pennsylvanian clastic section having a thickness of 900 to 1,300 feet (275 to 400 meters) in the project study area (Figure 1). The base of the interval is approximately 6,000 feet (1,830 meters) deep. Previous studies have established that the Bend Conglomerate was deposited in a fluvio-deltaic environment. These productive Bend Conglomerate clastics are underlain by extensive Paleozoic carbonates, the oldest and deepest of these being the Ellenburger Group of Ordovician age. Evidence of karst processes is frequently observed in Ellenburger rocks. The data shown here illustrate that some of these Ellenburger-related karsts create collapsed zones that extend to considerable heights, sometimes 2,000 feet (600 meters) or more. The resulting structural sags affect the overlying stratigraphy and can compartmentalize younger, siliciclastic reservoir systems. Karst-generated collapses created a reservoir compartment in a sandstone facies approximately 2,000 feet (600 meters) above a karst origin. For a more detailed discussion of this study, please refer to Hardage (1996). for those who wish additional information about the karst collapse phenomena that are presented.
3-D
A 3-D
In addition, this map shows the locations of
wells where vertical Data Interpretation
One unique aspect of Fort Worth Basin
stratigraphy revealed by the 3-D Inspection of the deeper Vineyard structure map (Figure 3) shows that several depressions occur in a seemingly random pattern across the Vineyard chronostratigraphic surface. These depressions tend to have circular to oval shapes, with diameters ranging from about 500 feet (150 meters) to about 3,000 feet (915 meters). Groups of collapse features sometimes occur along linear northwest-southeast trends, suggesting a genetic relationship between these stratigraphic disruptions and basement faults.
The
The
Profile ABC (Figure
5) traverses three of the
In a few instances, a disruption continues into the Strawn section above the Bend conglomerate. These structural collapse zones occur at a rather high spatial density, with adjacent collapses often separated by only one mile (1,600 meters) or less (Figure 5). As noted, each zone extends completely through the Pennsylvanian-age Bend Conglomerate, or at least through a significant part of the Bend conglomerate interval. Because of the stratigraphic disruption that these collapses cause within the Pennsylvanian section, some of these Ordovician-related structural sags were a significant influence on Pennsylvanian and Mississippian sedimentation, and thus these phenomena need to be considered when evaluating prospects in basins underlain by karst-prone carbonates. Geologic Mechanism For Collapse StructuresThese extensive vertical collapse zones are interpreted to be the result of post-Ellenburger carbonate solution, which occurred during periods of subaerial exposure. This karst model is adopted because karst-generated vertical collapse zones can be observed in Ellenburger outcrops in the Franklin Mountains at El Paso, Texas, and because Ellenburger karst plays are pursued by operators across the Permian Basin of West Texas.
In the Franklin Mountains outcrops, the
measured lateral dimensions of the collapsed features correspond to the
diameters of several of the disrupted zones observed in the 3-D The influence of this deep karst collapse on younger sedimentation needs to be studied at several sites between these two widely separated control points (El Paso and Wichita Falls) to understand better how karsting phenomenon affects hydrocarbon production and exploration strategy throughout the Permian and Delaware basins of West Texas. Compartmentalization of Siliciclastic Caddo Reservoir Due to Karst Collapse Processes One example of
deep-seated Ellenburger karst collapse that created reservoir
compartmentalization at the Caddo level some 2,500 feet (760 meters)
above the Ellenburger and in much younger, Atokan-age clastic rocks, is
the situation associated with the Sealy C-2 well, located in the
northeast quadrant of the 26-mile2 (67-kilometer2)
3-D
Following the shut-in period, the Sealy C-2
produced at a rate of 1.04 MMscf/d during a 24-hour flow test. Figure 8
is a plot of initial pressures in the Upper Caddo measured from wells in
the project area over time. The value of initial pressure for the Sealy
C-2 well is similar to those reported in wells drilled and completed in
the 1950s. Note that in each case the pressures reported are the best
estimates that could be obtained for particular wells using available
data sources (both operator and public domain records). The estimated
initial reservoir pressure for the Sealy C-2 of 1,300 psi represents a
pressure gradient of about 0.3 psi/ft (1 psi/m). This pressure suggests
that the Sealy C-2 location has been drained partially by surrounding
production, although the pressure is higher than would be expected,
given the extent of the offsetting production from the Upper Caddo. This
Caddo reservoir is in an underpressured
The northeast quadrant of the Caddo time
structure map (Figure 4) is enlarged in Figure
9, and the locations of
the Sealy C-2 and several neighboring wells are identified. This map
shows that the Sealy C-2 well was drilled on what appears to be a
structural high. However, when the structural and stratigraphic details
associated with the Sealy C-2 well are viewed in
The estimated Upper Caddo reservoir pressure
of 1,300 psi encountered in the C-2 well and the subsequent production
history (Figure 11) suggest that these low-displacement faults can be
partial barriers to fluid flow at the Caddo level. The area inside the
circumference of this Figure 11 shows the actual production from the Sealy C-2 well. This is a log-log plot of gas flow rate versus time. The well came on line in November 1992 and produced 800 to 900 Mscf/d for the first couple of months. After that, the gas flow rate gradually declined to about 200 Mscf/d after just over 2 years of production. The production data, when plotted this way, show an influence of reservoir boundaries, as evidenced by the concave downward shape of the later-time data.
The production data were history-matched with
an analytical reservoir model to estimate reservoir properties and gas
in place. As Figure 11 shows, the analytical model provides a good match
of the actual production data. From this
Reservoir performance thus supports the
Research QuestionsSeveral fundamental research questions remain to be answered, with the following issues being some of the more obvious:
Currently, we have only speculative answers to
these questions. Both the drill bit and the coring bit will continue to
provide valuable information about these intriguing karst phenomena.
Three-D ReferenceHardage, B.A., D.L. Carr, D.E. Lancaster, J.L. Simmons, Jr., R.Y.
Elphick, V.M. Pendleton, and R.A. Johns, 1996, 3-D |
 Figure 1. Fort Worth Basin study area.
 Figure 2. Well control within the study area.
 Figure 3. Interpreted time structure map for
the top of Vineyard. Features 1, 2 and 3 are only three of numerous
depressions across this chronostratigraphic surface.
Figure 3. Interpreted time structure map for
the top of Vineyard. Features 1, 2 and 3 are only three of numerous
depressions across this chronostratigraphic surface. Figure 4. Interpreted time structure for the
top of Caddo. Features 1, 2 and 3 are circular depressions on this
surface. Note that these depressions follow a NW-SE linear trend, an
alignment along a deeper basement fault.
Figure 4. Interpreted time structure for the
top of Caddo. Features 1, 2 and 3 are circular depressions on this
surface. Note that these depressions follow a NW-SE linear trend, an
alignment along a deeper basement fault. Figure 5.
  Figure 6.
 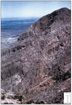 Figure
7d. Uninterpreted photograph of breccia
pipe exposed in an unnamed Ellenburger outcrop in the Franklin Mountains
(courtesy of F.J. Lucia). The Ranger Peak through Cutter section is
Ordovician age (Ellenburger equivalent); the Fusselman is a Silurian
unit.
Figure
7d. Uninterpreted photograph of breccia
pipe exposed in an unnamed Ellenburger outcrop in the Franklin Mountains
(courtesy of F.J. Lucia). The Ranger Peak through Cutter section is
Ordovician age (Ellenburger equivalent); the Fusselman is a Silurian
unit.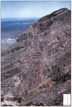 Figure 7e. Interpreted photograph of the breccia pipe.
 Figure 9. Time structure map of the Caddo in
the vicinity of the Sealy C-2 well, which is positioned on a structural
high that was created when surrounding strata sank into a ring of karst
collapsed zones.
Figure 9. Time structure map of the Caddo in
the vicinity of the Sealy C-2 well, which is positioned on a structural
high that was created when surrounding strata sank into a ring of karst
collapsed zones. Figure 10a. Profile along Line A
 Figure 10b. Profile along Line B,
 Figure 10c. Profile along Line C.
 Figure 10d. Profile along Line D.