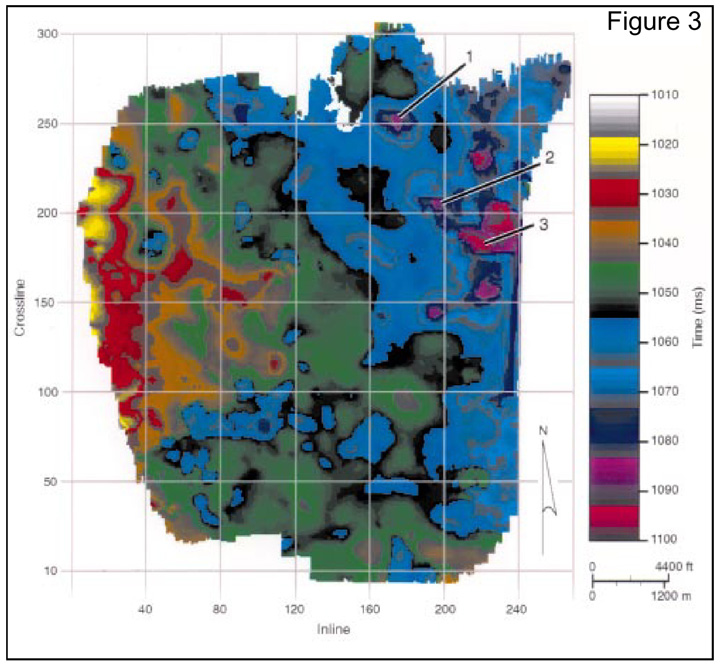
Figure 3. Interpreted time structure map for the top of Vineyard. Features 1, 2 and 3 are only three of numerous depressions across this chronostratigraphic surface.
Figure 3. Interpreted time structure map for the top of Vineyard. Features 1, 2 and 3 are only three of numerous depressions across this chronostratigraphic surface.