![]() Click to view article in PDF format.
Click to view article in PDF format.
By
Leslie B. Magoon1 and Edward A. Beaumont2
Search and Discovery Article #40068 (2003)
*Adaptation and revision for online presentation of Chapter 3, “Petroleum Systems,” by Leslie B. Magoon and Edward A. Beaumont, in Exploring for Oil and Gas Traps, Edward A. Beaumont and Norman H. Foster, eds., Treatise of Petroleum Geology, Handbook of Petroleum Geology, 1999, which may be purchased at AAPG Bookstore (http://bookstore.aapg.org).
1U.S. Geological Survey, Menlo Park, California.
2Independent petroleum geologist, Tulsa, Oklahoma.
This article discusses the concept and use of petroleum systems. It describes what petroleum systems are and how they can be identified and mapped. Two examples are given of a petroleum system, and application of the concept is described.
|
|
The petroleum system is a unifying concept that encompasses all of the disparate elements and processes of petroleum geology. Practical application of petroleum systems can be used in exploration, resource evaluation, and research. This article discusses its application to petroleum exploration. A petroleum system encompasses a pod of active source rock and all genetically related oil and gas accumulations. It includes all the geologic elements and processes that are essential if an oil and gas accumulation is to exist. Petroleum describes a compound that includes high concentrations of any of the following substances: · Thermal and biological hydrocarbon gas found in conventional reservoirs as well as in gas hydrates, tight reservoirs, fractured shale, and coal · Condensates · Crude oils · Natural bitumen in reservoirs, generally in siliciclastic and carbonate rocks System describes the interdependent elements and processes that form the functional unit that creates hydrocarbon accumulations. The essential elements of a petroleum system include the following: · Source rock · Reservoir rock · Seal rock · Overburden rock Petroleum systems have two processes: · Trap formation · Generation-migration-accumulation of hydrocarbons These essential elements and processes must be correctly placed in time and space so that organic matter included in a source rock can be converted into a petroleum accumulation. A petroleum system exists wherever all these essential elements and processes are known to occur or are thought to have a reasonable chance or probability to occur. A petroleum system investigation identifies, names, determines the level of certainty, and maps the geographic, stratigraphic, and temporal extent of a petroleum system. The investigation includes certain components: · Petroleum-petroleum geochemical correlation · Petroleum-source rock geochemical correlation · Burial history chart · Petroleum system map · Petroleum system cross-section · Events chart · Table of hydrocarbon accumulations · Determination of generation-accumulation efficiency
Identifying a Petroleum System Before a petroleum system can be investigated, it must be identified as being present. To identify a petroleum system, the explorationist must find some petroleum. Any quantity of petroleum, no matter how small, is proof of a petroleum system. An oil or gas seep, a show of oil or gas in a well, or an oil or gas accumulation demonstrates the presence of a petroleum system. The steps required to identify a petroleum system are: · Find some indication of the presence of petroleum. · Determine the size of the petroleum system by the following series of steps: a. Group genetically related occurrences of petroleum by using geochemical characteristics and stratigraphic occurrences. b. Identify the source using petroleum-source rock correlations. c. Locate the general area of the pod of active source rock responsible for the genetically related petroleum occurrences. d. Make a table of accumulations to determine the amount of hydrocarbons in the petroleum system and which reservoir rock contains the most petroleum. · Name the petroleum system. A unique designation or name is important to identify a person, place, item, or idea. As geologists, we name rock units, fossils, uplifts, and basins. The name for a specific petroleum system separates it from other petroleum systems and other geologic names. The name of a petroleum system contains several parts: 1. The source rock in the pod of active source rock 2. The name of the reservoir rock that contains the largest volume of in-place petroleum 3. The symbol expressing the level of certainty An example of a petroleum system name and its parts is shown in Figure 1. Figure 2 shows how a reservoir rock name is selected. A petroleum system can be identified at three levels of certainty: known, hypothetical, and speculative. The level of certainty indicates the confidence for which a particular pod of mature source rock has generated the hydrocarbons in an accumulation. At the end of the system's name, the level of certainty is indicated by (!) for known, (.) for hypothetical, and (?) for speculative. The following indicates how the level of certainty is determined: Known (!)--A positive oil-source rock or gas-source rock correlation Hypothetical (.)--In the absence of a positive petroleum-source rock correlation, geochemical evidence Speculative (?)--Geological or geophysical evidence
Geographic, Stratigraphic, and Temporal Extent Petroleum systems are limited by time and space. Each system can be described in terms of its own unique temporal and spatial elements and processes.
Temporal aspects A petroleum system has three important temporal aspects: (1) Age (2) Critical moment (3) Preservation time The age of a system is the time required for the process of generation-migration-accumulation of hydrocarbons. The critical moment is the time that best depicts the generation-migration-accumulation of hydrocarbons in a petroleum system. A map and cross-section drawn at the critical moment best show the geographic and stratigraphic extent of the system. The burial history chart (Figure 3) shows the critical moment and the essential elements for the fictitious Deer-Boar(.) petroleum system. The preservation time of the petroleum system begins immediately after the generation-migration-accumulation process occurs and extends to the present day. It encompasses any changes to the petroleum accumulations during this period. During the preservation time, remigration, physical or biological degradation, or complete destruction of the petroleum may take place. During the preservation time, remigrated (tertiary migration) petroleum can accumulate in reservoir rocks deposited after the petroleum system formed. If insignificant tectonic activity occurs during the preservation time, accumulations remain in their original position. Remigration happens during the preservation time only if folding, faulting, uplift, or erosion occurs. If all accumulations are destroyed during preservation time, then the evidence that a petroleum system existed is absent. An incomplete or just completed petroleum system lacks a preservation time.
Spatial Aspects Each petroleum system can be defined spatially by its geographic and stratigraphic extent. The geographic extent of a petroleum system is determined at the critical moment. It is defined by a line that circumscribes the pod of active source rock and all oil and gas seeps, shows, and accumulations originating from that pod. Figure 4 shows the geographic extent of the fictitious Deer-Boar(.) petroleum system. The stratigraphic extent of a petroleum system is the span of lithological units which encompasses the essential elements within the geographic extent of a petroleum system. The stratigraphic extent can be displayed on the burial history chart and cross-section drawn at the critical moment. The cross-section in Figure 5 shows the stratigraphic extent of the fictitious Deer-Boar(.) petroleum system at the critical moment.
Events Chart An events chart (Figure 6) shows the temporal relation of the essential elements and processes of a petroleum system. It also shows the preservation time and the critical moment for the system. An events chart can be used to compare the times that the processes occurred with the times that the elements formed. A petroleum system events chart shows time on one axis and the essential elements and processes on the other. The time required for the generation-migration-accumulation process is the same as the age of the system. The chart also shows the preservation time and critical moment for the system. The events chart for the fictitious Deer-Boar(.) petroleum system is shown in Figure 6. The events chart is arranged according to increasing difficulty. For example, mapping and dating the essential elements of a petroleum system are usually easier than mapping and determining the time over which the processes took place. Because the petroleum system deals only with discovered accumulations, there is no question that the elements and processes worked correctly to make oil and gas fields. Later, however, the events chart is transformed into a risk chart to better evaluate a play or prospect.
The size of a petroleum system includes the total volume of all recoverable hydrocarbons that originated from a single pod of active source rock. This total volume is used to compare against other petroleum systems and to determine the generation-accumulation efficiency. The discovered hydrocarbons include shows, seeps, and accumulations of oil and gas. The size of a petroleum system is determined using a table such as the following for the fields in the Deer-Boar(.) system, with reserves of approximately 1.2 billion barrels (bbl) (Table 1). Generation-accumulation efficiency is the ratio (expressed as a percentage) of the total volume of trapped (in-place) petroleum in the petroleum system to the total volume of petroleum generated from the pod of active source rock.
A petroleum system is mapped by showing the geographic, stratigraphic, and temporal extent of the system. The geographic extent is the area over which the petroleum system is known to occur. It is defined in map view by a line on the earth's surface that circumscribes the pod of active source rock as well as all the known petroleum shows, seeps, and accumulations that originated from that pod. The geographic extent is outlined to correspond to the time of the critical moment. It is similar to the known extent, or known geographic extent. The stratigraphic extent of a petroleum system is the span of lithological units which encompasses the essential elements within the geographic extent of a petroleum system. The stratigraphic extent can be displayed on the burial history chart and cross-section drawn at the critical moment. The stratigraphic extent is from below the pod of active source rock or the petroleum of the discovered accumulations in the system, whichever is deeper, to the top of the overburden rock. The temporal extent of the petroleum system is shown on the events chart and includes the age of the essential elements and processes, the preservation time, and the critical moment. By displaying together the time over which these separate events took place, the relation between forming and charging the traps containing the accumulations is easily evaluated. Examples of Two Petroleum Systems To better understand how a petroleum system is mapped and described, two examples are presented: the Mandal-Ekofisk(!) and the Ellesmerian(!) petroleum systems (from Cornford, 1994, and Bird, 1994, respectively). The petroleum in the former system migrated across stratigraphic units (or vertically) into many accumulations, whereas the latter migrated along stratigraphic units (or laterally) into a few accumulations. Both oil systems are multibillion barrels in size. These two examples illustrate many of the concepts and principles discussed above.
Mandal-Ekofisk(!) Petroleum System Introduction The Mandal-Ekofisk(!) petroleum system in the Central Graben of the North Sea contains 21.4 billion bbl of oil and 39.4 trillion ft3 of gas in 39 fields (Cornford, 1994). The age of the reservoir rock ranges from Devonian to Tertiary age with about 85% of the petroleum in rock adjacent to the Cretaceous-Tertiary boundary, specifically the Ekofisk Formation of Late Cretaceous age. Based on geochemical evidence, the Upper Jurassic (Kimmeridgian) to Lower Cretaceous source rock is the Mandal Formation. A positive oil-source rock correlation indicates a known system.
This petroleum system formed in sedimentary rocks deposited in a failed rift system in the North Sea between Great Britain, Norway, and Denmark. The prerift rocks are mostly underburden rocks and are not involved in this petroleum system except as reservoir rocks for a minor amount of petroleum. The synrift sedimentary section contains the source rock. The reservoir rock, seal rock, and overburden rock were deposited during the postrift period of sedimentation.
To determine more accurately when the Mandal source rock was actively generating petroleum, a burial history chart (Figure 7) was constructed. Based on this and other charts, peak generation of petroleum occurred at about 30 Ma, which was selected as the critical moment.
The petroleum system map in Figure 8 shows the pod of active source rock and the oil and gas accumulations that were charged by this same pod of active source rock; all are within the geographic or known extent of the system. Most accumulations for the Mandal-Ekofisk(!) overly the active source rock, and the gas/condensate fields overlie the most mature source rock.
Petroleum System Cross-section The petroleum system cross-section in Figure 9 shows migration pathways and the spatial relation of the active source rock to the reservoir rocks. This section trends longitudinally along the Central Graben and shows the vertical migration path from the active source rock through the Cretaceous rocks and horizontally along the basal Paleogene reservoir rocks until it accumulates in various traps. The underburden rock is pre-Late Jurassic in age and is not involved in the petroleum system except as minor reservoir rocks and where the Permian salt (Zechstein Group) creates diapirs that form petroleum traps and migration paths in fractured chalk.
The oil-source rock correlation is a multiparameter geochemical approach; biological markers are one parameter. Biological marker analysis by Mackenzie et al. (1983) and Hughes et al. (1985) from reservoirs in the Greater Ekofisk, Forties, Montrose, and Argyll fields shows that these oils originated from the Mandal Formation source rock, as illustrated in Figure 10.
An events chart indicates when the essential elements and processes took place to form a petroleum system, the critical moment, and the preservation time. In Figure 11, the source rock is the Upper Jurassic to Lower Cretaceous Mandal Formation, which was deposited as the rift formed. Most overburden rock of Cretaceous to Cenozoic age was deposited after the rift formed. The seal rock ranges from Permian to Neogene and consists of halite, shale, and chalk. Based on volume of petroleum, the Permian to Jurassic reservoir rocks are least important; the most important reservoir rocks are Late Cretaceous to early Paleogene in age. Most traps were created as the rift formed and filled through structural movement and halokenesis. Petroleum generation-migration-accumulation occurred from just over 100 Ma to the present day. The critical moment, or peak generation, is at 30 Ma.
The size of the Mandal-Ekofisk(!) petroleum system, as shown in Table 2, is determined by the total volume of in-place hydrocarbons that originated from the pod of active Mandal source rock. The in-place hydrocarbons are determined from the recoverable hydrocarbons and, where possible, surface deposits, seeps, and shows. Ellesmerian(!) Petroleum System Introduction The Ellesmerian(!) petroleum system of the North Slope, Alaska, contains approximately 77 billion bbl of oil equivalent (Bird, 1994). The age of the reservoir rock ranges from Mississippian to early Tertiary. Total organic carbon and assumed hydrogen indices from the marine shale source rocks indicate the mass of petroleum generated to be approximately 8 trillion barrels of oil (Bird, 1994). These estimates indicate about 1% of the generated hydrocarbons are contained in known traps. More importantly, the U.S. Geological Survey estimates another 1% is trapped in undiscovered accumulations in the Ellesmerian(!) petroleum system (Bird, 1994).
The North Slope evolved from a passive continental margin to a foredeep during the Jurassic. Prior to the Jurassic, Paleozoic and Mesozoic strata were deposited on a passive continental margin. They consist of Carboniferous platform carbonate rocks and Permian to Jurassic shelf to basinal siliciclastic rocks. The passive margin converted to a foredeep during the Jurassic and Cretaceous when it collided with an ocean island arc. The foredeep began to fill with sediments in the Middle Jurassic and continues to do so. The foredeep basin fill consists of orogenic sedimentary materials eroded from the nearby ancestral Brooks Range that were deposited as a northeasterly prograding wedge of nonmarine, shallow marine, basin-slope, and basin conglomerates, sandstones, and mudstones.
Figure 12 shows the areal extent of the Ellesmerian(!) petroleum system. The limit is determined by the extent of the contiguous active source rock and the related petroleum accumulations.
Petroleum System Maturity Map Figure 13 shows the thermal maturity of the two main Ellesmerian(!) petroleum system source rocks, the Shublik Formation and the Kingak Shale. Note that Ellesmerian(!) petroleum system traps (shown in Figure 12) are mostly located above immature source rocks.
Petroleum System Cross-Section The cross-section of the Ellesmerian(!) petroleum system (Figure 14) shows major structural-stratigraphic elements, the occurrence of oil fields, elevation of selected vitrinite reflectance values, and reflectance isograds.
Analysis of the burial history chart of the Inigok 1 well (Figure 15) and other burial history charts indicates peak petroleum generation (the critical moment) probably occurred in Late Cretaceous time (approximately 75 Ma) in the western North Slope and in early Tertiary time (approximately 50 Ma) in the central and eastern part of the North Slope. Also, note the large increase in the rate of sedimentation during the Early Cretaceous.
Biological marker analysis (Figure 16, left), from the main reservoir rock, Sadlerochit Group, of Prudhoe Bay field, shows that the oil originated from the Shublik Formation, the Kingak Shale, and the Hue Shale. Carbon isotopic composition comparisons (Figure 16, right) indicate that Shublik and Kingak share similar 13C values with oil from the Prudhoe Bay field, whereas the Hue Shale does not.
The events chart (Figure 17) for the Ellesmerian(!) petroleum system indicates when its elements and processes occurred. The cross-hatched pattern shows the estimated time of the tilting of the Barrow Arch, which resulted in remigration of petroleum from older to younger (early Tertiary) reservoir rocks.
The size of the Ellesmerian(!) petroleum system, shown in Table 3, is determined by the total volume of in-place petroleum that originated from the pod of active Ellesmerian(!) petroleum system source rock. The in-place petroleum is determined from the recoverable petroleum and, where possible, surface deposits, seeps, and shows. In Table 3, trap type A is structural, B is stratigraphic, and C is combination.
Applying the Petroleum System Concept: Basin, System, Play, and Prospect Words frequently have more than one meaning; nomenclature in this discipline of petroleum geology is no exception. To more clearly separate the petroleum system from the sedimentary basin and the play and prospect, the meaning of these words needs to be clarified with respect to each other and the petroleum province.
Petroleum province, a geographic term, is an area where petroleum occurs in commercial quantities. Basin is sometimes used geographically to mean petroleum province, such as the Williston Basin or Paris Basin. The Zagros fold belt could be a structural province or a petroleum province, not a basin. A map showing differential thickness of sedimentary rocks is used to determine basins (thick), uplifts (thin), and fold belts (folded). These features are properly named provinces; if they contain petroleum, they are called petroleum provinces. The use of "basin" in this context is improper; it is also inconsistent with the petroleum system concept described below, which defines "basin" as the area into which sedimentary rocks are deposited.
A sedimentary basin is a depression filled with sedimentary rocks. The presence of sedimentary rocks is proof that a basin existed. The depression, formed by any tectonic process, is lined by basement rock, which can be igneous, metamorphic, and/or sedimentary rock. The basin fill includes the rock matter, organic matter, and water deposited in this depression. In certain cases, such as with coal and some carbonate deposits, the sedimentary material is formed in situ. The essential elements of a petroleum system are deposited in sedimentary basins. Frequently, one or more overlapping sedimentary basins are responsible for the essential elements of a petroleum system. Traps are formed by tectonic processes that act on sedimentary rocks. However, the moment petroleum is generated, biologically or thermally, a petroleum system is formed.
The petroleum system includes the pod of active source rock, the natural distribution network, and the genetically related discovered petroleum occurrences. Presence of petroleum is proof that a system exists. The pod of active source rock is part of the petroleum system because it is the provenance of these related petroleum occurrences. The distribution network is the migration paths to discovered accumulations, seeps, and shows. In contrast to the play and prospect, which address undiscovered commercial accumulations, the petroleum system includes only the discovered petroleum occurrences. If an exploratory well encounters any type or amount of petroleum, that petroleum is part of a petroleum system.
The play and prospect are used by the explorationist to present a geologic argument to justify drilling for undiscovered, commercial petroleum accumulations. The play consists of one or more geologically related prospects, and a prospect is a potential trap that must be evaluated by drilling to determine whether it contains commercial quantities of petroleum. Once drilling is complete, the term "prospect" is dropped; the site becomes either a dry hole or a producing field. The presence of a petroleum charge, a suitable trap, and whether the trap formed before it was charged are usually involved in this evaluation. These terms are compared in Table 4.
Relationship of Play to Petroleum System In a play, the petroleum accumulations are commercial and undiscovered. In a petroleum system, the petroleum occurrences are already discovered (Magoon, 1995). Other differences are listed in Table 4. Usually, a play is predicated without any particular petroleum system in mind. However, when a play is based on a particular petroleum system, it is called a complementary play. The petroleum system concept is used two ways in exploration. By mapping a petroleum system, an explorationist learns new play concepts to add new oil or gas fields to the petroleum system. This relation is shown in the following equation: PStotal = PSpartial + CP1 + CP2 + CP3 where: The petroleum system is also used as an analog to another less-explored petroleum system. For this approach to work, the explorationist must have a series of petroleum system case studies available for comparison.
Applying the Petroleum System Concept: Reducing Exploration Risk In exploration, the general question is Where can we find substantial quantities of hydrocarbons that are economical to produce? To solve this problem, exploration geologists find and evaluate a prospect. In addition to helping evaluate petroleum charge, trap, and timing, the petroleum system concept can help in the exploration process by determining exploration intensity and assessing risk.
A play is one or more prospects that may define a profitable accumulation of undiscovered petroleum. Traditionally, a play is developed and evaluated without any particular petroleum system in mind. For example, if a prospect (play) is identified near a series of oil fields in anticlinal traps, it could be argued--using geophysics and geochemistry--that the prospect is an anticlinal trap charged with the same oil. Three independent variables--petroleum charge (fluids), trap (sedimentary rocks), and timing (time)--are usually evaluated. Petroleum charge is the volume and characteristics of the oil and gas available to the trap, if it exists. The trap includes the reservoir and seal rocks and the trapping geometry formed by the reservoir-seal interface. Timing is whether the trap formed before the petroleum charge entered the trap. Each independent variable has equal weight because if any variable is absent (0), the prospect is a failure; if all variables are present (1.0), the prospect is a commercial success. Therefore, each independent variable can be evaluated on a scale of zero to one (0-1.0). Exploration risk is determined by multiplying the three variables: charge, trap, and timing. Within each independent variable, a series of subevents (which are also independent) must be evaluated. For example, if a trap is to be evaluated, the reservoir rock must be mapped carefully and its properties predicted using geologic principals. A similar procedure is carried out for the seal and trapping geometry. These subevents must be reduced to a single number between 0 and 1.0 that represents the independent variable, the trap. The subevents that contribute to petroleum charge and timing should also be evaluated in a similar manner. A practical way to carry out this exercise is to first map the petroleum system so the knowledge about the system can be used to evaluate the complementary play.
The complementary play evaluates the exploration risk for finding undiscovered hydrocarbons associated with a particular petroleum system. First, the petroleum system case study is completed. As the case study develops, an idea(s) or play(s) that involves this petroleum system will occur to the investigator. This play complements the petroleum system because it could add hydrocarbons (if discovered) to the system. The events chart in Figure 18 shows how the risk chart for the complementary play (prospect) is related to the petroleum system vis-a-vis the three independent variables--trap, petroleum charge, and timing. The experience acquired while executing the petroleum system case study provides the measure of difficulty in mapping and determining the age of the essential elements and, more importantly, for the two processes--trap formation and generation-migration-accumulation of petroleum. Obviously, there is no risk or uncertainty related to the discovered accumulations in the petroleum system, but there are varying levels of difficulty in the reconstruction of events that caused these accumulations. This measure of difficulty can be incorporated into the risk chart. For example, geologic and geophysical information for the producing fields indicates the traps are easily mapped and the time of formation is narrowly constrained. However, this same type of information over the geographic extent of the petroleum system indicates these types of traps have all been tested successfully and the only prospects left are ones that are more difficult to map and date; hence, their relative risk increases. Using the risk chart in this manner allows the investigator and prospect evaluator an opportunity to separate what is known on the events chart from what is unknown on the risk chart for the prospect.
A petroleum system map can be used to evaluate the time and volume of hydrocarbon charge or to assign risk to a complementary play or prospect by using its position relative to the geographic extent of the system.
Using Figure 19 and stipulating that the
complementary play is on the migration path for this petroleum system, a
play located within or outside the geographic extent of the system has
the following level of risk: 1. Least risk; accumulations surround the trap.
Studies of the reservoir rock and seal rock as well as trap formation are needed to evaluate migration paths and traps.
In a petroleum province, drilling density usually indicates how intensively an area has been explored. Though this is a relative measure, a petroleum province having one exploratory well every square kilometer is well explored compared with a province that has one well every 100 km2. Exploration intensity by province ranges from lightly to moderately to heavily explored. However, in a petroleum province with overlapping petroleum systems, the shallowest petroleum system may be heavily explored compared with the deeper petroleum systems. To determine level of exploration, each petroleum system in the province of interest should be mapped and the size and location of the commercial accumulations compared with the dry exploratory wells. The dry-hole ratio or success ratio determines exploration intensity and success. The graphs in Figure 20 conceptually summarize the exploration process relative to time. The top graph shows that a frontier petroleum province or petroleum system starts with only prospects (1.00 or 100%); with time, some or all (shown here) of those prospects become oil (gas) fields. The bottom graph shows that the highest percentage of the cumulative petroleum reserves are found early in the exploration process. The quicker we determine the size and extent of a petroleum system, the more likely we will be able to decide whether to continue drilling exploratory wells.
Applying the Petroleum System Concept: Examples Linking the elements (source, reservoir, seal, and overburden) to the processes of petroleum geology (trap formation and hydrocarbon generation-migration-accumulation) is an effective exploration approach. Mapping and studying a petroleum system helps explorationists predict which traps will contain petroleum and which will not. It also helps them focus on that part of a province that will most likely contain accumulations. Below are some examples of how the petroleum system concept can be applied to petroleum exploration at local and regional levels.
Consider the cross-section in Figure 21, from the Papers Wash field from the San Juan Basin, New Mexico. The cross-section shows that three separate prospects (traps) were tested (drilled). The deepest trap was filled to the spill point with oil, the middle trap was partially filled, and the shallowest trap was empty. This arrangement suggests that oil mi grated to the traps from a mature source rock downdip to the north by filling the traps in sequence. If these three prospects in Figure 21 had not been tested, which would we drill first? With an understanding of the petroleum system that charged these prospects, we could be more confident in recommending which prospect to drill first. If we knew that mature source rock was located directly under the reservoir, then we would expect all traps to be filled an equal amount (Figure 22, left). Conversely, if we knew that the source was mature downdip to the north, then we would drill the deepest prospect, not the middle or shallowest prospect to the south (Figure 22, right).
Petroleum system studies may serve as analogs for undocumented petroleum systems in prospective petroleum provinces. Because a petroleum system study describes both elements and processes, we can use them as look-alike and work-alike analogs. Petroleum systems also can be classified in different ways according to our needs--an example of applying a petroleum system classification scheme to petroleum exploration.
Vertically drained petroleum systems Demaison and Huizinga (1994) divide petroleum systems into vertically and laterally drained. An earlier section of this chapter describes the Mandal-Ekofisk(!) petroleum system, which is a vertically drained system. Vertically drained systems are generally found in rifts, deltas, wrenches, and overthrust provinces where migration is controlled by faults and fractures. Faults and fractures limit the size of the fetch area available to traps, so a number of small- and medium-sized accumulations abound. Vertically drained systems (Figure
23) have the
following characteristics (Demaison and Huizinga, 1994): · Accumulations occur above or near to the pod of active source rock. · Lateral migration distances are short. · Multiple, stacked accumulations usually contain the same genetic oil. · Surface seepages are common in supercharged systems. · The largest accumulations are seldom found early in the drilling history; instead, many medium to small accumulations are found.
Laterally Drained Petroleum Systems According to Demaison and Huizinga (1994), laterally drained petroleum systems have a laterally continuous seal overlying a laterally continuous reservoir. This reservoir/seal couplet is generally contained within a long, uninterrupted ramp. Provinces with these systems have low to moderate structural deformation. Tectonic stability is critical for maintaining seal integrity. Laterally drained systems are most commonly found in foredeep and cratonic sag basins. Plunging low-amplitude arches are necessary for connecting traps to the pod of active source rock. The Ellesmerian(!) petroleum system is an example of a laterally drained system. Laterally drained systems (Figure 24) have the following characteristics: · Oil accumulations generally occur in thermally immature strata located far from the pod of active source rock. · Accumulations containing oil that migrated long distances on average account for 50% of the entrapped oil. · A single reservoir of the same age as the active source rock contains most of the entrapped oil and gas. · In supercharged systems, large deposits of heavy oil often occur in thermally immature strata near the eroded margin (geographic extent) of the petroleum system. · The largest accumulation is usually found early in the drilling history of the system. After that, mostly small accumulations are found (J. Armentrout, personal communication, 1997). The cross-section (Figure 24) is an example of a laterally drained petroleum system, patterned after the Eastern Venezuelan Basin.
Barker, C., 1992, The role of source rock studies in petroleum exploration, in K.S. Johnson and B.J. Cardott, eds., Source Rocks in the Southern Midcontinent, 1990 Symposium: Oklahoma Geological Survey Circular 93, p. 3-20. Bird, K.J., 1994, Ellesmerian(!) petroleum system, North Slope, Alaska, USA, in L.B. Magoon and W.G. Dow, eds., The Petroleum System--From Source to Trap: AAPG Memoir 60, p. 339-358. Cornford, C., 1994, The Mandal-Ekofisk(!) petroleum system in the Central Graben of the North Sea, in L.B. Magoon and W.G. Dow, eds., The Petroleum System--From Source to Trap: AAPG Memoir 60, p. 537-571. Demaison, G., and B.J. Huizinga, 1994, Genetic classification of petroleum systems using three factors: charge, migration, and entrapment, in L.B. Magoon and W.G. Dow, eds., The Petroleum System--From Source to Trap: AAPG Memoir 60, p. 73-89. Hughes, W.B., A.G. Holba, D.E. Miller, and J.S. Richardson, 1985, Geochemistry of the greater Ekofisk crude oils, in B.M. Thomas et al., eds., Petroleum Geochemistry in the Exploration of the Norwegian Shelf: London, Graham and Trotman, p. 75 -92. Mackenzie, A.S., J.R. Maxwell, and M.L. Coleman, 1983, Biological marker and isotope studies of North Sea crude oils and sediments: Proceedings of the 11th World Petroleum Congress, London, Section PD1(4), p. 45-56. Magoon, L.B., 1995, The play that complements the petroleum system--a new exploration equation: Oil & Gas Journal, vol. 93, no. 40, p. 85-87. Magoon, L.B., and W.G. Dow, 1994, The petroleum system, in L.B. Magoon and W.G. Dow, eds., The Petroleum System--From Source to Trap: AAPG Memoir 60, p. 3-24. Sedivy, R.A., I.E. Penfield, H.I. Halpern, R.J. Drozd, G.A. Cole, and R. Burwood, 1987, Investigation of source rock-crude oil relationships in the northern Alaska hydrocarbon habitat, in I. Tailleur and P. Weimer, eds., Alaskan North Slope Geology: Pacific Section SEPM Book 50, p. 169-179. Seifert, W.K., J.M. Moldowan, and R.W. Jones, 1980, Application of biological marker chemistry to petroleum exploration: Proceedings of the 10th World Petroleum Congress, Bucharest, p. 425-440. Vincelette, R.R., and W.E. Chittum, 1981, Exploration for oil accumulations in Entrada Sandstone, San Juan basin, New Mexico: AAPG Bulletin, vol. 65, p. 2546-2570.
Leslie B. Magoon
Edward A. Beaumont
|
 Figure 8. Present-day map of Mandal-Ekofisk (!)
petroleum system (after Cornford, 1994).
Figure 8. Present-day map of Mandal-Ekofisk (!)
petroleum system (after Cornford, 1994). Figure 9. Cross-section showing
hydrocarbon habitats in the Central Graben, illustrated with speculative
migration pathways (heavy arrows).
Figure 9. Cross-section showing
hydrocarbon habitats in the Central Graben, illustrated with speculative
migration pathways (heavy arrows).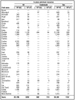 Table 2. Volumes of in-place
resources for the fields of the Mandal-Ekofisk(!) petroleum system
(after Cornford, 1994).
Table 2. Volumes of in-place
resources for the fields of the Mandal-Ekofisk(!) petroleum system
(after Cornford, 1994). Figure 15. Burial history chart of Inigok 1 Well,
with isotherms (from Bird, 1994).
Figure 15. Burial history chart of Inigok 1 Well,
with isotherms (from Bird, 1994). Table 3. Hydrocarbon resources in the Ellesmerian(!)
petroleum system (from Bird).
Table 3. Hydrocarbon resources in the Ellesmerian(!)
petroleum system (from Bird).
 Leslie B. Magoon graduated from the University of
Oregon in Eugene in 1966 with an M.S. degree in geology. Presently, he
is a senior research geologist with the U.S. Geological Survey, Menlo
Park, California. Prior to that he was with Shell Oil Company for 8
years as an exploration geologist. Over the last 32 years, he has been
involved in petroleum geology with emphasis on geochemistry in the Rocky
Mountain states, California, Alaska, Colombia, and Malaysia. He has
numerous publications on the geology and geochemistry of petroleum
provinces in Alaska, the Cook Inlet-Alaska Peninsula, and the North
Slope. For the last 15 years he has devoted much of his time to
developing and presenting the petroleum system. From 1990-1991, he was
an AAPG Distinguished Lecturer. At the 1996 AAPG Annual meeting, Magoon
and W.G. Dow, as coeditors, received the R.H. Dott, Sr., Memorial Award
for AAPG Memoir 60, The Petroleum System--From Source to Trap.
Leslie B. Magoon graduated from the University of
Oregon in Eugene in 1966 with an M.S. degree in geology. Presently, he
is a senior research geologist with the U.S. Geological Survey, Menlo
Park, California. Prior to that he was with Shell Oil Company for 8
years as an exploration geologist. Over the last 32 years, he has been
involved in petroleum geology with emphasis on geochemistry in the Rocky
Mountain states, California, Alaska, Colombia, and Malaysia. He has
numerous publications on the geology and geochemistry of petroleum
provinces in Alaska, the Cook Inlet-Alaska Peninsula, and the North
Slope. For the last 15 years he has devoted much of his time to
developing and presenting the petroleum system. From 1990-1991, he was
an AAPG Distinguished Lecturer. At the 1996 AAPG Annual meeting, Magoon
and W.G. Dow, as coeditors, received the R.H. Dott, Sr., Memorial Award
for AAPG Memoir 60, The Petroleum System--From Source to Trap. Edward A. (Ted) Beaumont is an independent petroleum geologist from
Tulsa, Oklahoma. He holds a BS in geology from the University of New
Mexico and an MS in geology from the University of Kansas. Currently, he
is generating drilling prospects in Texas, Oklahoma, and the Rocky
Mountains. His previous professional experience was as a sedimentologist
in basin analysis with Cities Service Oil Company and as Science
Director for AAPG. Ted is coeditor of the Treatise of Petroleum Geology.
He has lectured on creative exploration techniques in the U.S., China,
and Australia and has received the Distinguished Service Award and Award
of Special Recognition from AAPG.
Edward A. (Ted) Beaumont is an independent petroleum geologist from
Tulsa, Oklahoma. He holds a BS in geology from the University of New
Mexico and an MS in geology from the University of Kansas. Currently, he
is generating drilling prospects in Texas, Oklahoma, and the Rocky
Mountains. His previous professional experience was as a sedimentologist
in basin analysis with Cities Service Oil Company and as Science
Director for AAPG. Ted is coeditor of the Treatise of Petroleum Geology.
He has lectured on creative exploration techniques in the U.S., China,
and Australia and has received the Distinguished Service Award and Award
of Special Recognition from AAPG.