Print this page
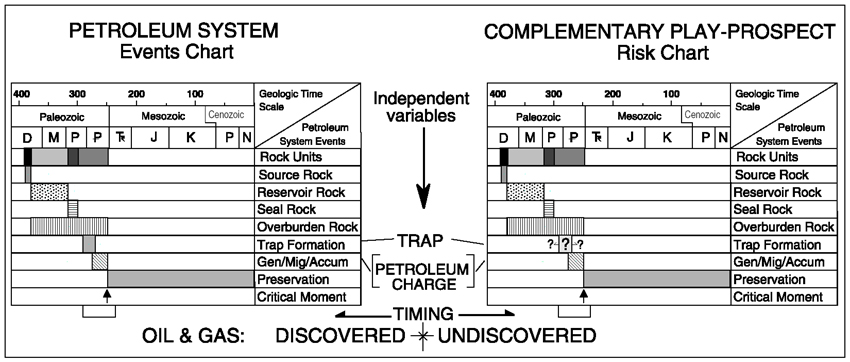
Figure 18. Petroleum system events chart (left) and complementary play-prospect risk chart (from Magoon, 1995).