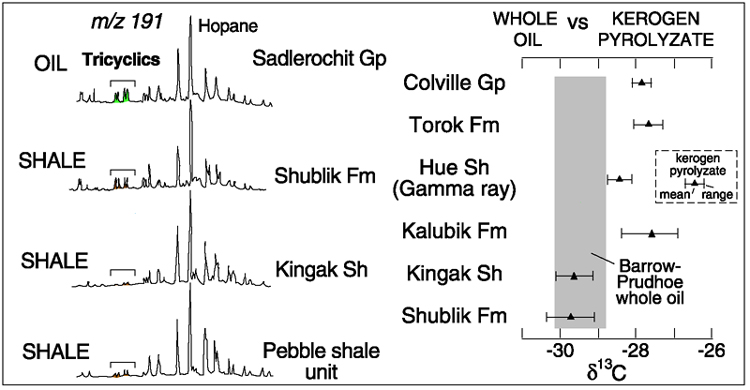
Figure 16. Left: Biomarker analysis from the main reservoir rock of Prudhoe Bay field in comparison to that from Shublik Formation, Kingak Shale, and Pebble shale unit (from Seifert et al., 1980). Right: 13C values are similar in the reservoir and Shublik Formation and Kingak Shale (right) (Sedivy et al., 1987).