The Effect of Allochthonous Salt on the Petroleum Systems of Northern Green Canyon and Ewing Bank (Offshore Louisiana), Northern Gulf of Mexico
Barry C. McBride, Paul Weimer, and Mark G. Rowan
Search and Discovery Article #10003 (1999)
| Adaptation for online presentation of article, of same title and by same authors, published in AAPG Bulletin, v. 82/5B, p. 1083-1112. Data copyrighted by AAPG. ©Copyright 1998. |
The northern Green Canyon/Ewing Bank region, northern Gulf of Mexico basin, contains the Oxfordian–Neogene (.), Tithonian–Neogene (.), Albian–Neogene (.), Turonian–Neogene (.), and Eocene–Neogene (.) petroleum systems. The systems encompass 42 fields or discoveries in the study area and include four subsalt discoveries. Essential elements of the systems include source shales of Oxfordian, Tithonian, Albian, Turonian, and Eocene age; Neogene siliciclastic turbidite reservoirs; allochthonous salt; and overburden strata ranging in age from Jurassic to Quaternary.
The petroleum systems of the area are significantly affected by the evolution of allochthonous salt. The high thermal conductivity of salt retards the thermal maturation of subsalt petroleum source rocks and causes late generation and migration from them. Most traps were formed during the Pliocene–Pleistocene, and the generation-migration-accumulation of petroleum ranges from early Miocene to the Holocene. The critical moment of peak oil generation for each source varies spatially and temporally as a function of the overlying sediments and allochthonous salt evolution.
The impermeability of salt prevents vertical petroleum migration and causes migration pathways to be deflected laterally up the dip of base salt. Where salt welds form, petroleum migration is unimpeded and continues vertically. By integrating predictions of potential source rocks, structural restorations, thermal maturation modeling, regional salt maps, and petroleum systems logic, we can determine petroleum migration pathways and zones of concentration. All 42 fields or discoveries within the study area are associated with predicted zones of paleosubsalt petroleum concentration. Present-day salt geometries do not delineate many of these zones because of salt weld formation during the Pleistocene. This generation, migration, and accumulation technique enables geoscientists to focus their exploration efforts toward areas with a greater probability of success.
Although the northern Gulf of Mexico Basin is one of the most extensively studied and explored sedimentary basins in the world, no consensus exists regarding the mechanics of its petroleum systems. This lack of consensus is primarily the result of the basin’s large size, thickness of strata, and complex structural evolution. In the offshore regions, much of the data needed for a petroleum systems analysis are difficult to compile because of the relatively shallow well penetrations (source rocks occur at much greater depths), the ambiguity of deep structure, difficult stratigraphic correlations, and the generally poor understanding of the evolution of specific allochthonous salt systems.
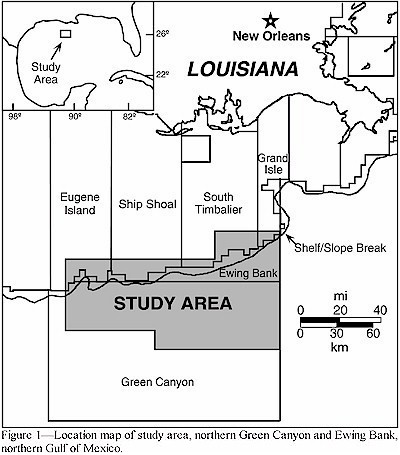
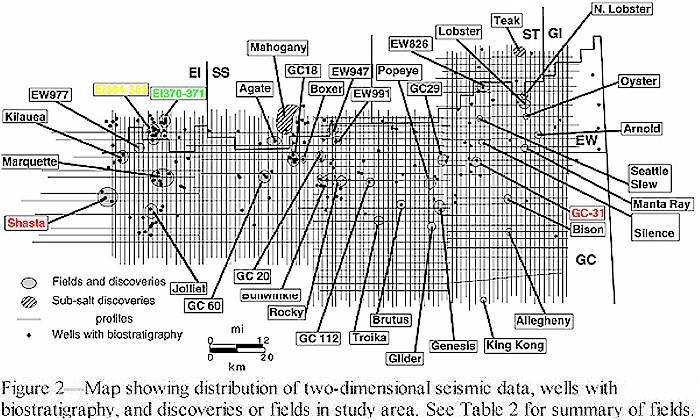
The northern Green Canyon/Ewing Bank area, offshore Louisiana (Figure 1), is a location where improved understanding of the structural evolution of allochthonous salt features now allows us to conduct petroleum systems analysis with greater confidence (McBride et al., 1998,). This region is a developing frontier exploration petroleum province with 38 fields or discoveries in suprasalt Pliocene–Pleistocene turbidite-related reservoirs (Figure 2; Table 1) (Weimer et al., 1998a). The region also includes active subsalt exploration with four subsalt discoveries: Mahogany (Ship Shoal 349), Agate (Ship Shoal 361), Teak (South Timbalier 260), and North Lobster (South Timbalier 308) in Miocene(?), turbidite-related reservoirs (Figure 2; Table 1). The area has experienced a complex structural history with multiple phases of extrusion and evacuation of allochthonous salt sheets and canopies (e.g., Rowan, 1995; McBride et al., 1998). Although the area is considered to have excellent potential for additional discoveries in the suprasalt, subsalt, and deeper water regions, relatively little has been published about the petroleum source rocks and their timing of maturation and expulsion, or secondary migration pathways. In particular, the effect of the evolution of allochthonous salt on the expulsion-migration subsystems has not been addressed.
Understanding the evolution of allochthonous salt is critical to petroleum systems analysis in the Gulf of Mexico because it affects (1) retardation of thermal maturation in subsalt petroleum source rocks and (2) subsalt petroleum migration pathways. Thermal maturation of subsalt source rocks is retarded due to the significantly higher thermal conductivity of salt compared to laterally adjacent siliciclastic strata; therefore, allochthonous salt transfers heat more effectively from deeper strata and keeps the underlying strata anomalously cool (O’Brien and Lerche, 1988; Mello et al., 1994; Waples, 1994a). Subsalt petroleum migration pathways are affected because the impermeable salt deflects migration pathways laterally up the dip of the base salt near the salt/sediment interface. By integrating predictions of potential source rocks, structural restorations, thermal maturation modeling, and petroleum systems logic (Smith, 1994), it is possible to delineate spatially and temporally thermal maturity, petroleum migration pathways, and, most importantly, zones of focused petroleum migration and accumulation through time.
The purpose of this paper is to illustrate how an integrated structural and stratigraphic interpretation and quantification of the incremental evolution of allochthonous salt constrains maturation modeling and petroleum systems analyses within the Gulf of Mexico. The analysis of the expulsion-migration subsystems of each petroleum system in this manner enables an exploration program to focus its efforts on regions with a much greater probability of petroleum accumulation and discoveries. In this paper, we intend to stimulate thinking regarding the implementation of petroleum system analysis toward exploration in the Gulf of Mexico, as well as toward other salt-related basins in the world.
The northern Green Canyon/Ewing Bank study area is contained within the north-central portion of the Gulf of Mexico Basin. The basin is approximately 1500 km (930 mi) in diameter, with Upper Triassic–
Holocene sedimentary rocks reaching thicknesses of 10–15 km (6–9 mi) (Salvador, 1991a).
Structural Setting and Evolution
The Gulf of Mexico Basin formed as a consequence of rifting and attendant crustal stretching and thinning during the Late Triassic–Early Jurassic as the North American plate separated from the African and South American plates (e.g., Pilger, 1981; Pindell, 1985; Sawyer et al., 1991). Beta (crustal extension) values have been proposed to range from 1.0 to 4.5 throughout the basin (Sawyer et al., 1991), and from 3.2 to 4.2 within the study area. This means the thickness of the crust has thinned from 69 to 76%. Mesozoic subsidence was greatest within the central portion of the basin due to thermal effects; Cenozoic subsidence was greatest along the northern margin of the basin due to sedimentary loading beneath regional depocenters.
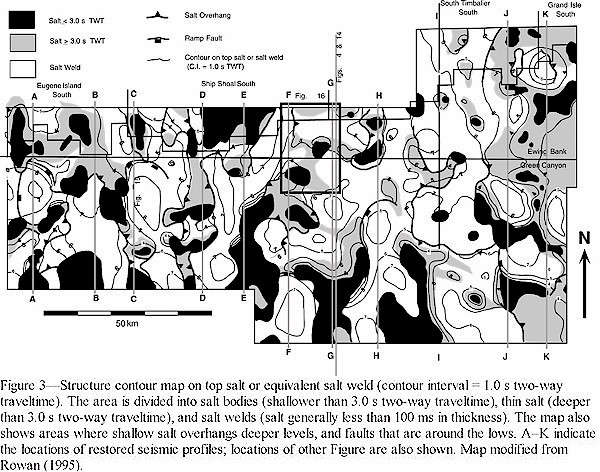
Within the northern Green Canyon/Ewing Bank study area, the present-day geometry is dominated by allochthonous salt and associated evacuation structures, such as extensional growth faults, salt welds, and contractional folds (Figure 3 see animation of Figures 3, 17, and 18, Figure 4 see animation). The time structure map (Figure 3 see animation of Figures 3, 17, and 18) is a composite map; where there is a discrete thickness of salt, the top salt has been mapped, and where salt is believed evacuated, the resultant salt weld has been mapped. The study area comprises a structurally complex, multilevel salt system consisting of a series of allochthonous, rootless salt bodies and salt welds that are the result of an interplay between salt-stock canopies and salt sheets (Rowan, 1995; McBride et al., 1998).
Restorations of a north-south cross section across the study area illustrate the timing of allochthonous salt extrusion and amalgamation to form a composite salt-stock canopy/salt-sheet canopy that was subsequently loaded and evacuated (Figure 4 see animation)(McBride, 1998). This cross section was extracted from a megaregional cross section extending from onshore Mississippi to the central Gulf of Mexico (~590 km; 365 mi) (McBride, 1998). Working at a megaregional scale provided better control on interpreting depth to basement, deep structures, and stratigraphic thicknesses.
The major structural feature of the study area during the early–middle Miocene was a bulb-shaped salt stock in the central portion of the section that had been growing at least since 40 Ma (Figure 4G see animation). This salt stock is believed to have been sourced from the autochthonous Louann Salt, with its feeder stem just out of the plane of section. A relatively rapid pulse of lateral spreading during the middle Miocene produced a prominent overhang along the southern margin of the salt stock and a relatively minor one along its northern margin by approximately 10.5 Ma (Figure 4E, F see animation). By the late Miocene (8.8 Ma, Figure 4D, see animation), the salt stock had amalgamated with an allochthonous salt sheet flowing from the north to form a composite salt-stock/salt-sheet canopy. The similarity in timing between the spreading of the salt stock and the basinward advance of the salt sheet suggests a similar origin, as a result of either a regional reduction in sedimentation rates or a regional acceleration of salt flow due to updip loading, or both.
Evacuation of the allochthonous salt began during the late Miocene and culminated during the Pliocene–Pleistocene as the major clastic depocenter sourced from the Mississippi Delta prograded into the study area (Figure 4A–C see animation). During this period, allochthonous salt continued to flow basinward in advance of the prograding depocenter until the salt became encased by sediments sometime during the Pleistocene (Figure 4A see animation). Contractional features developed where the advancing salt sheet amalgamated with the salt stock. These structures are partially compensating extension above the salt sheet farther to the north.
The structural restorations illustrate that salt within the study area has undergone a dynamic evolution, with dramatic thickness variations occurring both laterally and temporally. Salt thicknesses were constrained by the restoration method of Rowan (1993). The two-dimensional (2-D) technique makes no assumptions about the kinematics of salt deformation, and salt area is not necessarily maintained. Salt is assumed to flow into or out of the section because of the three-dimensional (3-D) kinematics of salt deformation. In addition, salt can leave the system entirely by dissolution. The method incorporates decompaction, isostasy, thermal subsidence, and paleobathymetry, and its accuracy has been demonstrated by Rowan et al. (1996). Ignoring these factors has a major impact on the restored thickness of salt through time, and thus on the timing of salt weld formation (Figure 6 see animation). The absence of properly restored salt thicknesses through time in turn leads to incorrect modeling of the timing of subsalt thermal maturation and subsalt petroleum migration pathways.
Restoration results are largely determined by the interpreted stratigraphic correlations. Restorations to times older than the deepest strata penetrated by wells are less reliable. In the interpretation shown in Figure 4A see animation), for example, the oldest strata in the central minibasin were assumed to be younger than the youngest adjacent subsalt strata. The resulting restorations show that the entire central minibasin was originally filled with salt (Figure 4E see animation). If the oldest strata in the minibasin were coeval with the shallowest subsalt strata, however, the restoration would show that upward and lateral growth of the salt stock occurred as a result of loading and evacuation of the stock rather than as a result of flow from the deep source. Thus, the depicted thicknesses of salt in the stock (Figure 4C–G see animation) are the maximum possible, and may be overestimates of the thickness variation through time.
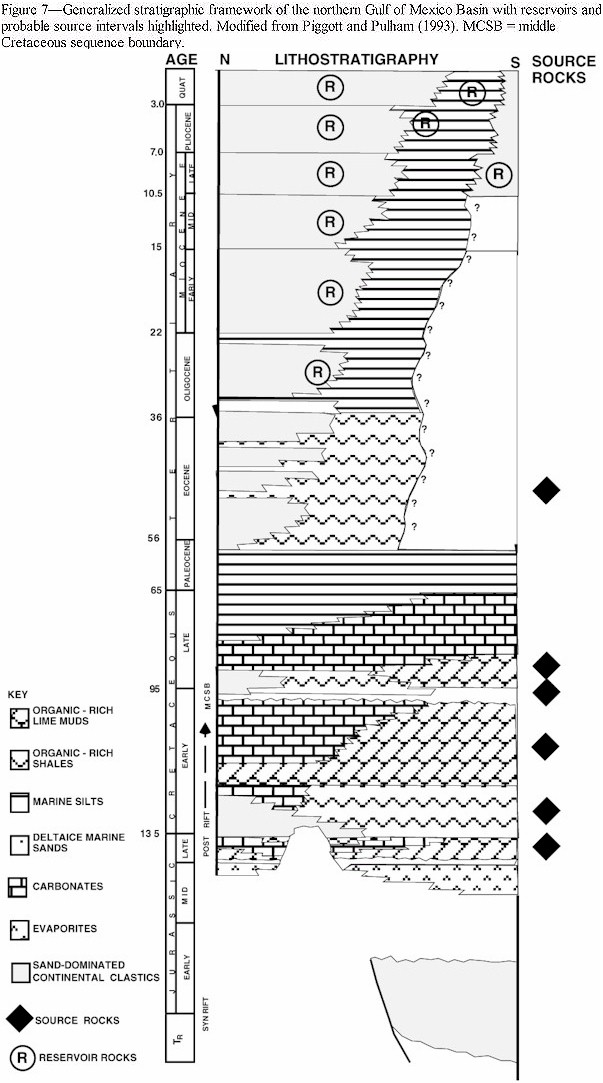
Mesozoic synrift and postrift strata comprise nonmarine siliciclastics, overlain by evaporites, marine carbonates, and shales (e.g., McFarlan and Menes, 1991; Salvador, 1991b; Sohl et al., 1991). Cenozoic strata record a history of thick, siliciclastic wedges, prograding primarily along the basin’s northwestern and northern margins, and major episodes of allochthonous salt extrusion and evacuation (e.g., Worrall and Snelson, 1989; Galloway et al., 1991; Diegel et al., 1995; Peel et al., 1995). Numerous regional unconformities and depositional hiatuses subdivide the Mesozoic and Cenozoic. The following description of the regional stratigraphy of the northern Gulf of Mexico is summarized from Salvador (1987, 1991a), Piggott and Pulham (1993), and Weimer et al. (1994, 1998b) and illustrated in Figure 7.
Following the deposition of synrift Upper Triassic–Lower Jurassic sediments, extensive, thick deposits of Louann Salt (>4 km [2.5 mi] locally) accumulated throughout much of the basin during the Callovian. Thickness variations in salt were probably related to the basement rift geometry of fault-bounded grabens. The basement geometry shown in Figure 4 see animation was taken directly from the regional depth-to-basement map of Sawyer et al. (1991). This surface was smoothed and does not show any fault blocks associated with initial rifting. Basement faults undoubtedly exist along this profile, but they cannot be resolved with present seismic or gravity data sets because of the great depth to basement and the interference of shallow salt. Trudgill et al. (1995) suggested that basement faults beneath the Perdido fold belt controlled original salt thickness variations.
From the Late Jurassic–Early Cretaceous, the basin became rimmed by broad, stable, carbonate shelves, banks, and ramps; meanwhile, pelagic carbonate ooze and shale were deposited in the deeper portions of the basin. Following the widespread middle Cretaceous unconformity (middle Cretaceous sequence boundary) (Buffler, 1991), siliciclastic sediments began dominating the stratigraphy with the development of the Woodbine and Tuscaloosa deltas. Chalk deposition then developed during the Late Cretaceous to form the Austin and Selma chalks. By the end of the Cretaceous, the sediments were predominantly shales and silts.
During the Cenozoic, thick siliciclastic depocenters began prograding into the northwestern and northern portions of the basin (Winker, 1982) in response to the Sevier and Laramide orogenies in the western United States and Mexico. These sediments are in excess of 10 km (6 mi) thick locally. The study area during this time consisted primarily of slope turbidite systems deposited in bathyal water depths, with Pliocene–Pleistocene strata reaching thicknesses of up to 6000 m (20,000 ft). These sediments were shale dominated, with sands developing locally within channel-levee systems and basin-floor fans.
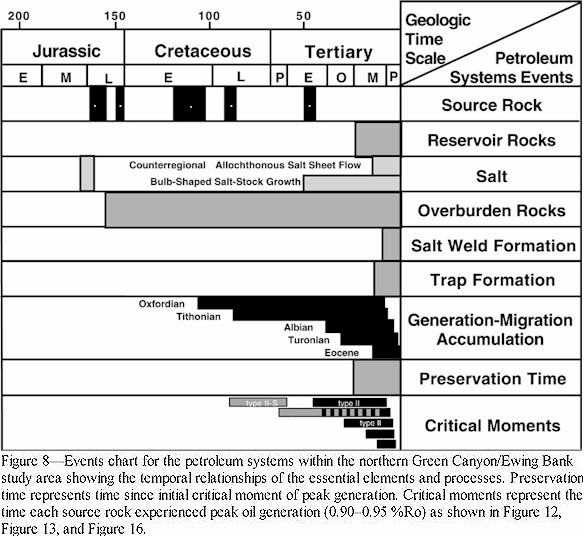
A petroleum system consists of all the geologic elements and processes responsible for source rock maturation and petroleum generation, migration, and accumulation (Magoon, 1989; Demaison and Huizinga, 1991; Magoon and Dow, 1994). Discussion of all the petroleum systems of the northern Gulf of Mexico Basin is beyond the scope of this paper; however, the northern Green Canyon/Ewing Bank study area is large enough to constrain key petroleum system components believed to be representative of a much larger portion of the basin. Figure 8 summarizes the timing of the key events for the various petroleum systems thought to be present within the Green Canyon/Ewing Bank area. The main focus of this paper is the effects of salt evolution on the expulsion-migration subsystem. A more detailed discussion of these elements is presented in following sections.
Specific names for individual petroleum systems are not given in the traditional manner (i.e., source rock and major reservoir rock names) because of the diversity of reservoir ages, the regional variations in reservoir nomenclature, and the apparent mixing of petroleum originating from multiple sources within individual reservoirs. Furthermore, all the numerous reservoirs are Neogene in age; therefore, the individual petroleum systems are consolidated and simplified based on the age of the potential source rocks and reservoir rocks. Hence, the study area contains the Oxfordian–Neogene (.), Tithonian–Neogene (.), Albian–Neogene (.), Turonian–Neogene (.), and Eocene–Neogene (.) petroleum systems. Because none of these source rock intervals have been penetrated within the study area, the level of certainty for these petroleum systems has been assigned as hypothetical (see Magoon and Dow, 1994, for explanation of these symbols).
Mesozoic and Cenozoic source rocks of the Oxfordian, Tithonian, Albian, Turonian, and Eocene are believed to be responsible for the majority of oil and gas accumulations in the northern offshore Gulf of Mexico Basin (Nunn and Sassen, 1986; Curtis, 1989; Bissada et al., 1990; Sassen and Chinn, 1990; Kennicutt et al., 1993; Piggott and Pulham, 1993; Sassen et al., 1993; Wenger et al., 1994) (Figure 7). Although these strata have not been penetrated by exploration drilling in the offshore, they have been identified onshore and within Deep-Sea Drilling Project (DSDP) sites 535 and 540 and have been correlated to known petroleum accumulations using biomarkers, whole-rock pyrolysis, and gas chromatograms (Herbin et al., 1983; Patton et al., 1983; Oehler, 1984; Sassen et al., 1988; Sassen and Moore, 1988; Walters and Dusang, 1988; Sassen, 1990; Sassen and Chinn, 1990; Wenger et al., 1990, 1994; Piggott and Pulham, 1993); therefore, deposition of these source rocks is assumed to be widespread throughout the northern Gulf of Mexico Basin. Biomarker compounds and geochemical analyses of crude oils from deep-water seeps and produced oils are consistent with deeply buried Mesozoic carbonate and siliciclastic source rocks (Nunn and Sassen, 1986; Bissada et al., 1990; Piggott and Pulham, 1993; Sassen et al., 1993) and Eocene siliciclastic source rocks (Wenger et al., 1994). These sources were deposited in marine environments, and most of the kerogen is of type II or type II-S (sulfur rich). Where penetrated, the source rock ages correspond to global oceanic anoxic events that are associated worldwide with organic-rich source rock deposition and petroleum accumulations (Ulmishek and Klemme, 1990).
Offshore drilling has not encountered any effective Cenozoic oil source rocks; shales within producing intervals are invariably organically lean and thermally immature, and contain only gas-generating type III kerogen (Dow, 1984; Nunn and Sassen, 1986; Curtis, 1989; Bissada et al., 1990). Such information has been used to argue that older, more deeply buried source rocks were necessary to generate petroleum found within relatively young, shallowly buried reservoirs (e.g., Curtis, 1989; Bissada et al., 1990). This model created a paradox of how to explain late expulsion and long-distance vertical migration of petroleum out of the deeply buried source rocks and into young reservoirs and traps (Curtis, 1989). Modeling suggested deeply buried source rocks should have matured much earlier (i.e., Mello and Karner, 1996). Although much of the shallow gas within Pleistocene reservoirs has been attributed to biogenic sources based on its isotopically light composition, thermogenic methane has also been found within Pleistocene, Pliocene, and Miocene reservoirs (Rice, 1980; Rice and Claypool, 1981; Curtis, 1989).
Maturity modeling was conducted across the study area along the regional cross section (Figure 4A see animation) to determine the lateral and temporal effects of allochthonous salt flow and evacuation on the timing and distribution of subsalt source rock maturities. Thirteen pseudo-wells were created along the profile for one-dimensional (1-D) modeling using the software package BasinMod. Input parameters used for modeling are listed in Table 2 and Table 3.
The burial history of the stratigraphic section was modeled across the study area. Present-day thicknesses were measured directly from the cross section (Figure 4A see animation). Variations in salt thickness and water depth through time were measured using the appropriate structural restorations (Figure 4B–G see animation). No significant periods of erosion were incorporated within the models. Petrophysical parameters necessary for calculating compaction, porosity, and thermal conductivity were calculated automatically by BasinMod as a function of rock type specified for each horizon (Table 2). Compaction was calculated using the equation of Baldwin and Butler (1985). One-dimensional Airy isostatics and thermal subsidence calculations were incorporated in the construction of the restorations.
Overpressures were not incorporated within the models in this study. To incorporate overpressures properly into the burial history requires fluid-flow modeling, which is beyond the scope of this study. Overpressure zones can vary spatially and temporally. Presence of overpressure may increase the thermal gradient because overpressured strata in the Gulf of Mexico are commonly more porous than normally pressured rocks, and therefore have lower thermal conductivity. The overpressure zone acts as an insulator, causing deeper strata to achieve hotter temperatures than normally pressured strata (Mello and Karner, 1996).
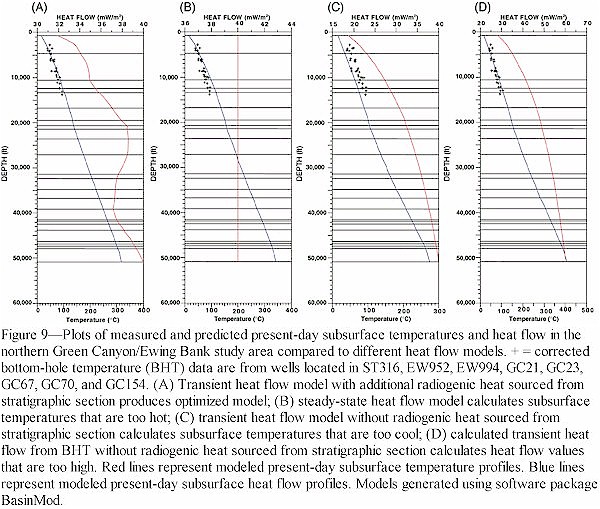
A present-day mean annual sea-floor temperature at 96 m (314 ft) below sea level of 17.8°C (64.0°F) (Cathles and Nunns, 1991) was used to calculate the mean annual sea-floor temperature at each of the 1-D modeling locations. Temperatures were decreased by 4°C/100 m (2.2°F/100 ft) for the first 200 m (656 ft) below sea level, and 2°C/100 m (1.1°F/100 ft) at depths greater than 200 m (656 ft), with a minimum value of 4°C (39°F) (Waples et al., 1992a; Waples, 1994a). Present-day temperature profiles were obtained by using corrected bottom-hole temperatures (BHT) of wells in and near the study area using bottom-hole temperature correction curves for the Gulf Coast (F. Meissner, 1993, personal communication). Thirty-one BHT measurements were used with depths ranging from 837 m (2747 ft) to 4205 m (13,794 ft), and temperature correction factors ranging from 1.13 to 1.42. These temperature values were not used as true input data for the modeling, but to constrain sedimentary radiogenic heat values and present-day heat flow following the method of Waples et al. (1992a).
Although the BHT correction method used is common, BHT data overall constitute a low-quality data set of temperature observations. A multitude of BHT correction techniques have been published (e.g., Horner, 1951; Middleton, 1979; Deming, 1989; Hermanrud and Shen, 1989), and the degree of bias and error inherent in these measurements has been analyzed (Hermanrud et al., 1990). Even though the method used in this study may give temperatures that are too low by 5–10°C (9–18°F), these errors can be partly eliminated by using data from as many wells as possible, and using the deepest measurements available (Hermanrud et al., 1990). Consequently, we used 33 BHT measurements from eight wells in Ewing Bank and northern Green Canyon. Although more sophisticated BHT correction techniques or drill-stem test temperatures can considerably reduce errors (Hermanrud et al., 1990; Waples et al., 1992a), we believe the quality of the data set and correction technique used in this study are acceptable for the objectives of this paper.
Thermal conductivities were calculated automatically by the thermal modeling software (BasinMod) for each rock unit based on its lithology, porosity, and temperature (Waples et al., 1992a) (Table 2). Rock types were estimated based on nearby well penetrations, regional net sand trends, and regional stratigraphic trends (Salvador, 1991a; Piggott and Pulham, 1993; Pulham, 1993; 1996, personal communication). A value of 6.5 W/m3 was used for the thermal conductivity of salt. No measured thermal conductivity values were available for this study area.
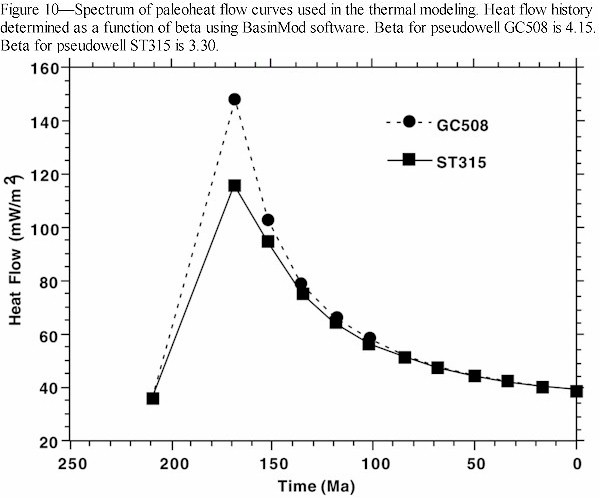
Several heat transfer assumptions were used within the modeling runs (modified from Waples et al., 1992a). (1) Heat was assumed to come from the basement (pre-Middle Jurassic Louann Salt) and radiogenic heat sources within the sedimentary section. (2) The basement heat source was not differentiated between radiogenic heat from the basement and heat from mantle convection. (3) Heat transfer was by conduction and by water expelled vertically during compaction. (4) Transient thermal conditions were used to model heat flow at the base of the sedimentary section to the sea floor. (5) All present-day heat flows were modeled at 40 mW/m2, and paleoheat flows varied through time (40–150 mW/m2) as a function of the estimated local beta value for the opening of the Gulf of Mexico at about 190 Ma (Sawyer et al., 1991).
Present-day heat flow measurements made along the sea floor west of the study area range from 19 to 104 mW/m2, dependent on the thickness and proximity of underlying salt (Nagihara et al., 1993). Likewise, surface heat flow measurements made in northern Louisiana and adjacent Mississippi range from 39.7 to 83.7 mW/m2 as a function of underlying salt geometries (Smith et al., 1981). Nunn et al. (1984) predicted a value of 41.8 mW/m2 onshore in north Louisiana. Sclater and Nagihara (1991) noted the distinctive contrast between high heat flow values collected along the sea floor over areas of shallow salt vs. relatively uniform and low heat flow values over salt-free areas and between salt. These workers suggested these lower values (~40 mW/m2) were more representative of the geothermal heat flux through the lithosphere; therefore, 40 mW/m2 was used as the present-day heat flow for all of the maturity modeling in this study.
Historically, radiogenic heat production of sedimentary rocks and its contribution to heat flow density has been considered insignificant (Hermanrud, 1993); however, work by Keen and Lewis (1982) and McKenna and Sharp (1998) indicated that radiogenic-heat production from sediment can contribute from 15 to 26% of the overall surface heat flow density. Although measurements of radiogenic heat production in Gulf of Mexico sediments are sparse, radiogenic-heat values were assigned to the stratigraphic column as a function of rock type based on published values by Epp et al. (1970), Keen and Lewis (1982), Pollack et al. (1993), Nagihara et al. (1996), and McKenna and Sharp (1998) (Table 2).
Based on this information, we tried to optimize the data set following the method of Waples et al. (1992a, b) by constructing a temperature profile that fit the surface temperature and BHT and honored the 40 mW/m2 heat flow value, while applying a transient heat flow model and maintaining acceptable radiogenic-heat values for the stratigraphy (Figure 9A). A steady-state heat flow model calculated subsurface temperatures that were too hot and did not match the BHT measurements (Figure 9B). Conductivities needed to be raised approximately 25% for the steady-state heat flow model to match the BHT. A transient heat flow model without radiogenic-heat sources from the sedimentary section calculated subsurface temperatures that were too cool (Figure 9C). Basal heat flow values calculated from the BHT with a transient heat flow model without radiogenic-heat sources from the sedimentary section were too high compared to published values (Figure 9D). We consider the parameters used to constrain Figure 9A to be the most reasonable, and used these values for thermal maturation modeling.
Paleoheat flow was constrained using the structural evolution of the basin as presented by Sawyer et al. (1991). Sawyer et al. (1991) proposed the basin formed as a result of rifting between 210 and 170 Ma, and calculated beta values progressively increasing from 1.0 (no extension) to 4.5 (oceanic crust formation) from onshore to offshore, respectively. Paleoheat flow values were calculated using the BasinMod rifting heat flow option that uses the McKenzie (1978) and Jarvis and McKenzie (1980) rifting models. For this study, heat flow from the basement is modeled at the base of the Louann Salt, with a sudden increase to a maximum during the rifting, followed by an exponential decay to the present-day value of 40 mW/m2 (Figure 10). Paleoheat flows for the individual 1-D models were varied as a function of the beta values mapped by Sawyer et al. (1991).
Neither vitrinite-reflectance (Ro) values nor any other thermal-indicator data were available for this study; therefore, calculated paleotemperatures, heat flows, or thermal maturity cannot be constrained or optimized in a manner similar to the temperature profile and BHT values discussed. Miocene and younger sediments, however, have been reported to be thermally immature (Dow, 1984; Nunn and Sassen, 1986; Curtis, 1989; Piggott and Pulham, 1993), in agreement with the modeling results of this study.
The results of thermal maturation modeling depend on many variables and factors, some of which are poorly constrained. Thus, the calculated timing of events (e.g., peak oil generation) may be inaccurate; however, we are more concerned here with the patterns, both spatial and temporal, produced by allochthonous salt evolution on maturation. Because the variables and modeling methods are internally consistent, we consider the shifting patterns shown here to be realistic.
Thermal maturity of the stratigraphic section was calculated using a kinetic model from the Lawrence Livermore National Laboratory (Sweeney and Burnham, 1990). This model calculates multiple parallel reactions as organic matter transforms to petroleum. The model calculates vitrinite-reflectance (%Ro) values that are used to map the thermal maturity windows of oil (0.6–1.2 %Ro), peak oil (0.9–0.95 %Ro), wet gas (1.2–2.0 %Ro), and dry gas (2.0–2.6 %Ro) used in this study (F. Meissner, 1993, personal communication). Standard type II kerogen and its associated default kinetic parameters were used as well (Table 3). In addition, transformation ratios were calculated for the individual source rocks using standard type II kerogens for the Eocene, Albian, and Turonian source rocks and type II-S kerogens for the Tithonian and Oxfordian source rocks (Table 3). The type II-S kerogens were modeled using n-component kinetics determined for the Monterey and Kirkuk (Iraq) formations (Tissot et al., 1987) because no data have been published for the potential type II-S Jurassic source rocks in the Gulf of Mexico. The timing of peak petroleum generation (critical moment) for a particular source rock is defined as when the transformation ratio equals 0.5.
The thermal maturation modeling indicates that potential Jurassic source rocks may have been generating petroleum since the Late Cretaceous, depending on the kinetics of the source rocks (Figure 11A, B, E, F). The modeling indicates Oxfordian type II-S kerogens generate petroleum as much as 90 m.y. earlier than standard type II kerogens, depending on the magnitude of paleoheat flow and allochthonous salt history (Figure 11A, E). The timing of the critical moment for Oxfordian type II-S kerogens is most sensitive to variations in the paleoheat flow history rather than allochthonous history (Figure 11A, E); however, the timing of peak petroleum generation varies spatially among the other source rocks, depending on the overlying salt evolution and burial history (Figure 11B, C, F, I).
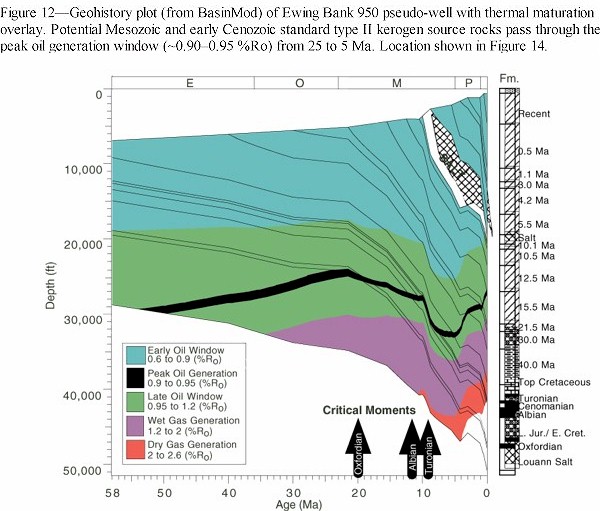
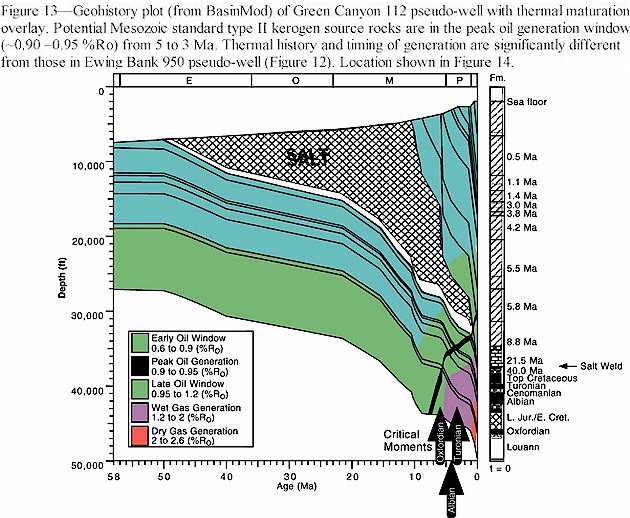
Figure 12 and Figure 13 are geohistory plots that represent end-member examples of allochthonous salt geometries within the study area (thin sheet vs. thick bulb-shaped salt stock, respectively) that later underwent complete or partial evacuation. The relatively late timing of maturation and petroleum generation of the subsalt type II kerogen source rocks is a result of the high thermal conductivity of salt (O’Brien and Lerche, 1984, 1988; Blackwell and Steele, 1989; Yu and Lerche, 1992; Mello et al., 1994; Pepper and Yu, 1995). Allochthonous salt acts as a radiator that cools underlying strata, creating anomalously low temperatures in subsalt strata while anomalously heating suprasalt strata. The thermal maturation retardation of subsalt strata enables deep Mesozoic and Cenozoic potential source rocks (Oxfordian, Tithonian, Albian, Turonian, and Eocene) within the study area to be actively generating petroleum before, during, and after Neogene reservoir deposition (Figure 11, Figure 12, and Figure 13). Work by Mello and Karner (1996) determined significantly older (Cretaceous–Paleogene) ages for maturation and generation of Mesozoic source rocks. Those results were obtained by integrating the effects of overpressures, but did not incorporate the effects of the high thermal conductivity of allochthonous salt.
The critical moment of petroleum generation for each of the potential sources varies throughout the study area (Figure 14 see animation). This variation is a direct result of the difference in age and maximum thickness of the original overlying allochthonous salt bodies, as well as variations in the timing and degree of salt evacuation. Because the timing of the critical moment of peak oil generation for a particular source rock varies so dramatically across the study area, the different source intervals may all be within the peak oil generation window at the same time, but in different locations (Figure 14 see animation). Figure 14 see animation was constructed by posting the output from thirteen BasinMod 1-D thermal maturation models onto a portion of the regional cross section restorations (from Figure 4 see animation) and connecting zones of equivalent maturity. The overlying salt geometry was taken under consideration during interpolation of maturity boundaries. The combination of structural restorations with 1-D thermal modeling nicely illustrates salt-influenced retardation of subsalt maturation, its lateral variations, and its rapid reequilibration once a salt weld forms (Figure 14 see animation). Because multiple source rocks may be within the peak oil generation window at the same time, it is likely that multiple sources contribute petroleum to the same reservoir rocks within any particular accumulation.
Neogene siliciclastic turbidite systems comprise the reservoir rocks within the petroleum systems of northern Green Canyon/Ewing Bank (e.g., Cook and D’Onfro, 1991; Brannon et al., 1993; Holman and Robertson, 1994; Rafalowski et al., 1994; Harrison et al., 1995; Snyder and Nugent, 1995; Weimer et al., 1998b). These sediments were deposited within bathyal water depths in intraslope basins controlled primarily by active salt tectonics (Weimer et al., 1994, 1998b; Rowan and Weimer, 1998). Seismic and geologic facies show abrupt variations both laterally and temporally as a function of the structural controls on sediment pathways across the slope, and the positioning of shallow/marginal marine depocenters.
Most of the reservoirs occur within Pliocene and lower Pleistocene sands deposited in a variety of environments (Weimer et al., 1994, 1998b). Although the sediments are generally all fine grained, differences in geometries and rock types exist among these turbidite systems. Detailed sequence stratigraphic interpretations of this area were published by Acosta (1994), Martinez (1994), Navarro (1994), Budhijanto (1995), and Varnai (1996). Older reservoirs may exist within the study area, but wells have penetrated only to the upper middle Miocene.
The level of certainty for a petroleum system represents the degree to which the available geological and geochemical data support the hypothesis that petroleum within the reservoir rocks originated from the designated source rocks (Magoon and Dow, 1994). The three levels of certainty are (1) known (!), (2) hypothetical (.), and (3) speculative (?) (see Magoon and Dow, 1994). General agreement exists that the source of oil for the Neogene reservoirs in the northern Green Canyon/Ewing Bank area is not from interbedded shales, but rather must be derived from depths well below current production (e.g., Bissada et al., 1990; Sassen et al., 1993). Because the proposed deep source rocks have not been penetrated in the offshore nor confirmed to be the actual sources for petroleum, the level of certainty for the Oxfordian–Neogene, Tithonian–Neogene, Albian–Neogene, Turonian–Neogene, and Eocene–Neogene petroleum systems has been assigned to hypothetical (.). In addition, it is not possible to determine the actual thickness, richness, thermal maturity, or areal extent of any of the individual sources responsible for generating the petroleum found within the study area; however, because of the reasonably well-established correlations between offshore oils and onshore source rocks of Mesozoic and Eocene age, the level of certainty for these petroleum systems could perhaps be raised to known (!).
Petroleum migration pathways in the Gulf of Mexico are believed to be predominantly vertical, driven by buoyancy and accentuated by compaction, dewatering, overpressures, microfractures, and faulting (Dow, 1984; Nunn and Sassen, 1986; Curtis, 1989; Hanor and Sassen, 1990; Demaison and Huizinga, 1991; Pratsch, 1991; Piggott and Pulham, 1993; Sassen et al., 1993; Waples, 1994b; Pepper and Yu, 1995; Mello and Karner, 1996). In the Green Canyon/Ewing Bank area, Neogene strata are dominated by fine-grained turbidite systems, whereas the deeper section we consider to be dominated by fine-grained, bathyal to distal mudstones and micrites. Significant fluid flow through such fine-grained rocks occurs only if large fluid-potential gradients are present (England et al., 1991). Significant overpressures were generated during the Cenozoic in this region due to rapid deposition of extremely thick sediments (Piggott and Pulham, 1993; Mello and Karner, 1996). Because the rate of deposition within a sedimentary basin usually changes slowly in a lateral direction, overpressure gradients are primarily vertical (England et al., 1991).
The combination of buoyancy and overpressure causes petroleum migration to be predominantly vertical in mudstones and other low-permeability strata (England et al., 1991). Overpressuring also results in low effective stress that promotes low sealing capacities and the creation of vertically oriented tension fractures, both of which further enhance vertical migration (Phillips, 1972; Meissner, 1978; du Rouchet, 1981; Piggott and Pulham, 1993; F. Meissner, 1993, personal communication; Mello and Karner, 1996). The vertical fractures occur when pore fluid pressure exceeds the least compressive stress (s3, horizontal) and causes the rock to undergo tensile failure (Phillips, 1972; Meissner, 1978; Mello and Karner, 1996).
Concentration of petroleum along some Gulf of Mexico fault zones clearly shows that faults can play a major role in collecting and focusing petroleum migration (i.e., Vicksburg flexure in south Texas Frio-Vicksburg play); however, such occurrences commonly are associated with laterally extensive reservoir (carrier) beds offset by faulting and disrupting lateral petroleum flow. Regionally widespread, coarse-grained carrier beds that could have deflected regional petroleum migration pathways from vertical are most likely not present in the study area. Sandstone reservoirs, such as sheet sands and channel-fill sands, tend to be isolated and areally restricted. Some faults appear to serve as local migration conduits based on the occurrence of petroleum seeps at the sea floor along fault traces (Sassen et al., 1993) and apparent four-dimensional seismic anomalies (Anderson et al., 1991a, b, 1994). Faults may provide local zones of enhanced permeability, but they are unlikely to significantly deflect vertical petroleum migration flow paths because faults in the study area tend to be relatively steep and to access small drainage areas.
In contrast, allochthonous salt, which is impermeable, is believed to form major barriers to vertical petroleum migration (House and Pritchett, 1995; McBride et al., 1995; Pepper and Yu, 1995). The impermeability of salt prevents petroleum migration through it, causing petroleum migration pathways to be deflected laterally beneath salt (House and Pritchett, 1995; McBride et al., 1995; Pepper and Yu, 1995). Hydrofracturing associated with overpressures has no effect on salt because of the ability of salt to flow in a ductile manner.
Allochthonous Salt and Petroleum Migration Pathways
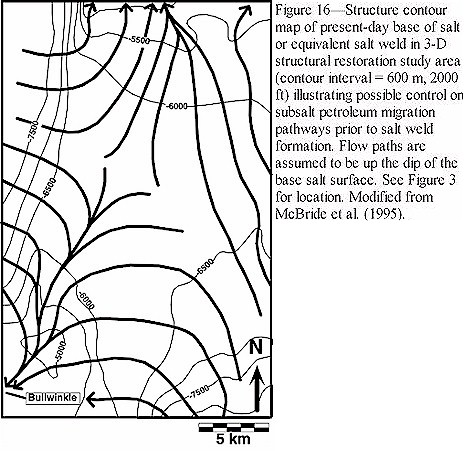
Subsalt petroleum migration has been proposed to be vertical until it reaches the base of salt, at which point it is deflected laterally up the dip of the base salt (House and Pritchett, 1995; McBride, 1995; McBride et al., 1995; Pepper and Yu, 1995) (Figure 15 see animation, and Figure 16). Because of the variability of salt geometries through time, it is critical to understand the structural evolution of allochthonous salt to reconstruct ancient subsalt petroleum migration pathways and current accumulations. By integrating structural restorations of salt (2-D and 3-D), regional salt maps, thermal maturation modeling (1-D), and petroleum systems logic (Smith, 1994), potential petroleum migration pathways and zones of focused flow through time can be reconstructed.
By careful integration of eleven structural restorations across the study area (Figure 3 profiles A–K see animation of Figures 3, 17, and 18) and the regional top salt/salt weld structure map (see Figure 3 see animation of Figures 3, 17, and 18), we interpreted past and present subsalt petroleum migration pathways and zones of petroleum concentration. The first step was to construct a base-salt structural form map. Where salt has been evacuated, the mapped weld represents the base of the original salt bodies. Where allochthonous salt is still present, the base of salt could sometimes be imaged, but in other places the base of salt was estimated by projection and interpolation. These eleven structural restorations (Figure 3 profiles A–K see animation of Figures 3, 17, and 18) were constructed using the same methodology described for Figure 4 see animation and are discussed in detail by McBride et al. (1998).
The base-salt form map was then used to predict potential regional subsalt petroleum migration pathways prior to salt weld formation (Figure 17 see animation of Figures 3, 17, and 18). Migration pathway arrows were drawn perpendicular to structural contours and point up the dip of the interpreted base salt (orthocontour, see MacKenzie and Quigley, 1988). There are several limitations and potential sources of error in this map. First, the map is based on the geometry of the base salt and thus is only as good as the base-salt structural interpretation. Second, the base-salt geometry is assumed to be primary and not significantly affected by subsequent deformation. Finally, and most importantly, the map does not represent a discrete moment in time, but rather is diachronous across the region due to variations in the timing of both salt extrusion and salt weld formation. Thus, the deflection of petroleum migration pathways shown in any given place is what would have occurred when salt was present at that location, which varies across the area from roughly the early Miocene (21.5 Ma) to the present. To map the petroleum migration pathways at a discrete moment in time requires 3-D structural restorations (see McBride, 1997).
Figure 17 see animation of Figures 3, 17, and 18 depicts 32 subregional, subsalt cells of petroleum migration (areas of fetch) and concentration. Within these cells, major potential subsalt migration pathways (arteries) and zones of focused flow can be delineated. The structural style of the salt system (salt-stock canopies vs. salt sheets) (see Rowan, 1995; Schuster, 1995) has the greatest impact on these pathways. Individual salt stocks cause migration to disperse as a result of the elliptical, conical geometry of the base-salt surface; however, amalgamation of two or more stocks into a canopy creates domelike geometries along the base-salt surface between the salt stocks. Fluid flow is focused toward these culminations. In contrast, the base salt of allochthonous salt sheets tends to be more subhorizontal, with regional dips landward; therefore, petroleum migration beneath sheets tends to be unfocused. The merging of allochthonous sheets and salt-stock canopies, however, creates ridges and highs along the base-salt surface, and these are more likely to concentrate fluid flow. The potential subsalt migration pathways shown in Figure 17 see animation of Figures 3, 17, and 18 assume hydrostatic conditions, and full-scale fluid-flow modeling is needed to evaluate whether these, in fact, are viable.
Allochthonous Salt and Petroleum Accumulation
The locations of 42 fields or discoveries in the northern Green Canyon and Ewing Bank region may be explained, in part, by being located within, above, or in proximity to the predicted zones of subsalt petroleum migration concentration (Figure 17 see animation of Figures 3, 17, and 18). Numerous additional zones where subsalt petroleum migration has been concentrated also have been modeled, but have not yet been tested. Because Figure 17 assumes a regional presence of salt, however, it does not accurately depict the true migration scenario throughout time. Remigration of petroleum from subsalt zones of concentration to suprasalt sediments would have occurred when salt welds formed, creating windows through the original allochthonous salt bodies and allowing vertical migration to resume. Thus, Figure 17 is supplemented by a map of present-day subsalt migration pathways (Figure 18 see animation of Figures 3, 17, and 18). Figure 18 is noticeably different from Figure 17 because of extensive salt weld formation throughout the region. Where salt still exists, regional subsalt petroleum migration pathways are the same as depicted in Figure 17; where salt welds are present, petroleum migration is considered vertical and flow paths are not shown. Salt weld surfaces are not uniformly transmissible to vertical migration, and therefore may alter the interpreted migration pathways.
Many of the zones of subsalt petroleum migration concentration illustrated in Figure 17 no longer exist because of the dynamic evolution of salt (see Figure 18). Nevertheless, numerous areas still remain as zones of subsalt petroleum migration concentration from deep source rocks currently generating petroleum. The locations of most suprasalt fields tend to be along the flanks of present-day allochthonous salt (Figure 18) and near zones of concentrated subsalt flow (Figure 17). We presume that fields have not been found above areally extensive allochthonous salt because these sediments are still shielded by the salt from receiving petroleum-generated subsalt. Likewise, zones of subsalt concentration still covered by allochthonous salt are potential areas of subsalt entrapment.
Although beyond the scope of this study, volumetrics of the amount of petroleum generated within each of the individual flow cells could be estimated by conducting more extensive thermal maturation modeling in 2-D or 3-D, and by using mass balance/genetic yield potential calculations for the various source beds (Waples, 1979, 1981; MacKenzie and Quigley, 1988); however, because there are no penetrations of these source rocks, the necessary input parameters for source richness, thicknesses, and genetic yield would have to be estimated. In addition, more extensive structural restorations in 3-D would be required to constrain the allochthonous salt thicknesses through time. Nevertheless, the exercise would be beneficial in ranking the individual cells based on the predicted volumes of generated petroleum, migration distances, and timing relationships relative to salt tectonics.
Figure 17 see animation of Figures 3, 17, and 18 and Figure 18 see animation of Figures 3, 17, and 18 depict only petroleum migration pathways and concentration; other factors such as the presence of high-quality reservoir rocks and adequate structural trapping configurations are needed for commercial discoveries. The combination of petroleum migration pathway maps, geologic facies maps, depth-structure maps, and thermal modeling is essential to high-grade areas of interest and focus exploration efforts. The petroleum flow-path maps provide a means of estimating the area of fetch and quantities of petroleum generation and concentration. In addition, these maps provide information that could be used to influence bidding and leasing strategies.
The northern Green Canyon/Ewing Bank region, northern Gulf of Mexico Basin, is believed to contain the Oxfordian–Neogene (.), Tithonian–Neogene (.), Albian–Neogene (.), Turonian–Neogene (.), and Eocene–Neogene (.) petroleum systems. The systems encompass 42 fields or discoveries in the study area and include four subsalt discoveries. Essential elements of the systems include source rocks of Oxfordian, Tithonian, Albian, Turonian, and Eocene age; Neogene siliciclastic turbidite reservoir rocks; allochthonous salt as migration barriers; and overburden strata ranging in age from Late Jurassic to Quaternary. Although the petroleum systems cover a much larger area regionally, analyses were restricted to the local study area and focused on the expulsion-migration subsystems.
The petroleum systems of the study area were significantly affected by the evolution of allochthonous salt. Assessing these evolving petroleum systems requires a means of quantifying allochthonous salt flow (changing salt thicknesses through time). The integration of sequence stratigraphy and structural restorations of allochthonous salt provides the necessary foundation for conducting thermal maturation modeling and petroleum migration analyses. Sequence stratigraphy constrains the geometries and ages of the incremental structural restorations. The incremental structural restorations, in turn, constrain salt thickness variations through time and the timing of salt weld formation. The high thermal conductivity of salt retards the thermal maturation of subsalt source rocks and causes late petroleum generation below thick salt bodies. The fine-grained strata of the region, in association with hydrocarbon buoyancy, faults, fractures, and overpressures, causes fluid flow to be primarily vertical; however, the impermeability of salt prevents vertical petroleum migration and causes migration pathways to be deflected laterally up the dip of the base of allochthonous salt. Where salt withdrawal eventually formed a salt weld, vertical petroleum migration is unimpeded; therefore, the petroleum systems of the region are a hybrid of vertical and lateral drainage associated with low and high impedance to flow. Lateral and vertical migration pathways varied spatially and temporally throughout the basin’s evolution.
Most known traps were formed during the Pliocene–Pleistocene, and the generation-migration-accumulation of petroleum started during the Late Cretaceous and continues to the present; however, the critical moment of peak oil generation for each of the potential source rocks varies throughout the study area as a function of the overlying allochthonous salt evolution. Because the critical moment of peak oil generation varies spatially, overlaps in the timing of generation exist among the different source rocks. This relationship enhances the prospectivity of this area because it allows late generation in multiple source rocks, and early migration and accumulation into numerous porous Neogene reservoirs.
By integrating predictions of potential source rocks, structural restorations, thermal maturation modeling, regional salt maps, and petroleum systems logic, it is possible to delineate potential petroleum migration pathways and their variations through time, and to identify potential zones of focused petroleum flow through time. Major allochthonous salt sheets and canopies existed during periods of peak oil generation (late Miocene–late Pliocene). The base-salt geometry during these times influenced regional subsalt petroleum migration pathways and created zones of petroleum concentration beneath salt. All 42 fields or discoveries within the study area are located directly in, above, or very close to the zones of subsalt petroleum migration concentration. Most of these fields are within suprasalt reservoirs that get charged with remigrated petroleum once salt welds form above zones of subsalt petroleum concentration. Present-day salt distributions and geometries do not delineate many of these zones of ancient subsalt petroleum migration concentration because of the extensive formation of salt welds during the Pleistocene; however, many prospective zones of subsalt petroleum concentration have remained active to the present because salt welds have not yet formed above them.
The proposed methodology of evaluating the effect of allochthonous salt evolution on petroleum systems sheds light on the expulsion-migration subsystems. Sequential structural restorations, when used for petroleum systems analysis, can provide substantial benefits to explorationists in addition to validating interpretations. The overall technique enables geoscientists to focus their exploration efforts toward areas with the greatest probability of exploration success. Although the method delineates zones of petroleum concentration, reservoirs and traps still need to be present and mapped within these areas for commercial discoveries.
FIGURES AND TABLES (with respective caption accompanying each)