Click to view presentation in PDF format.
A Geologic Review of the Mahogany Subsalt Discovery: A Well That Proved a Play*
(The Mahogany Subsalt Discovery: A Unique Hydrocarbon Play, Offshore Louisiana**)
Holly Harrison1, Dwight ‘Clint’ Moore2, and Peggy Hodgkins3
Search and Discovery Article #60049 (2010)
Posted April 28, 2010
*Adapted from presentation at AAPG Annual Convention, 1995, and from **extended abstract prepared for presentation at GCSSEPM Foundation 16th Annual Research Conference, “![]() Salt
Salt![]() , Sediment and Hydrocarbons,” December 3-6, 1995.
, Sediment and Hydrocarbons,” December 3-6, 1995.
Extended abstract used with permission of GCSSEPM Foundation whose permission is required for further use.
Appreciation is expressed to GCSSEPM Foundation, and to Dr. Norman C. Rosen, Executive Director, for permission to use it in this adaptation.
1 Phillips Petroleum Company, Bellaire, TX; currently BP, Houston, TX ([email protected])
2 Anadarko Petroleum Corporation, Houston, TX; currently ION Geophysical Corporation, Houston, TX ([email protected])
3 Amoco Production Research, Tulsa, OK; currently Veritas Hampson-Russell, Calgary, AB ([email protected])
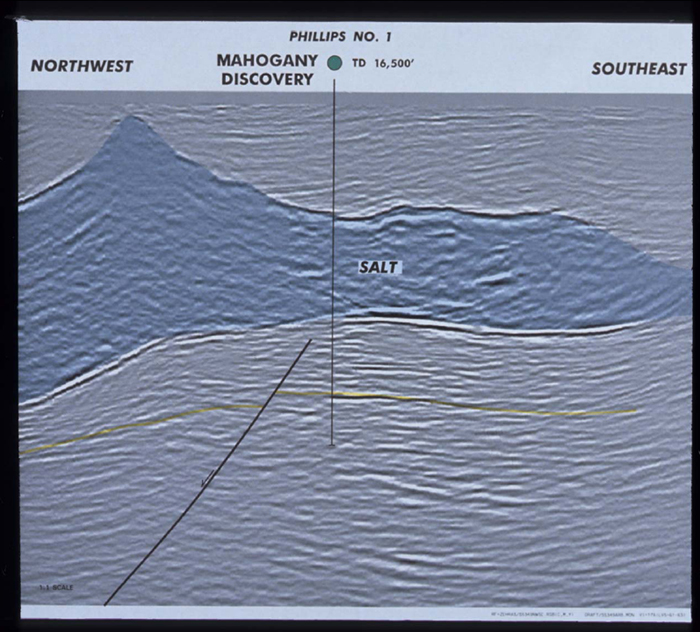
The Mahogany subsalt discovery of Phillips Petroleum Company, in partnership with Anadarko Petroleum Corporation and Amoco Production Company, is the petroleum industry's first commercial subsalt oil development in the Gulf of Mexico. Located 80 miles offshore Louisiana on Ship Shoal Blocks 349 and 359, the Mahogany #1 (OCS-G-12008) was drilled in 375 ft of water to a depth of 16,500 ft and tested both oil and gas below an allochthonous ![]() salt
salt![]() sheet. The discovery well tested 7256 BOPD and 7.3 MMCFD on a 32/64" choke at 7063 PSI flowing tubing pressure (FTP). The #2 delineation well (OCS-G-12008) was drilled from the same surface location to a depth of 19,101 ft MD (18,572 ft TVD). A different zone in this well was tested in July, 1994, and flowed 4366 BO and 5.315 MMCFD on a 20/64” choke at 6287 PSI FTP. These flow rates suggest that high sustainable production rates can be expected, and they are confirmed by rock property studies and detailed well log analysis. A third well (OCS-G-12010 #2) was spud in
September, 1994.
sheet. The discovery well tested 7256 BOPD and 7.3 MMCFD on a 32/64" choke at 7063 PSI flowing tubing pressure (FTP). The #2 delineation well (OCS-G-12008) was drilled from the same surface location to a depth of 19,101 ft MD (18,572 ft TVD). A different zone in this well was tested in July, 1994, and flowed 4366 BO and 5.315 MMCFD on a 20/64” choke at 6287 PSI FTP. These flow rates suggest that high sustainable production rates can be expected, and they are confirmed by rock property studies and detailed well log analysis. A third well (OCS-G-12010 #2) was spud in
September, 1994.
The primary subsalt reservoir is a high-pressured oil sand with high permeability and porosity and has tremendous deliverability. The field is located 80 miles offshore Louisiana on Ship Shoal South Additions blocks 349/359. The structure is interpreted as a faulted anticline overlain by allochthonous ![]() salt
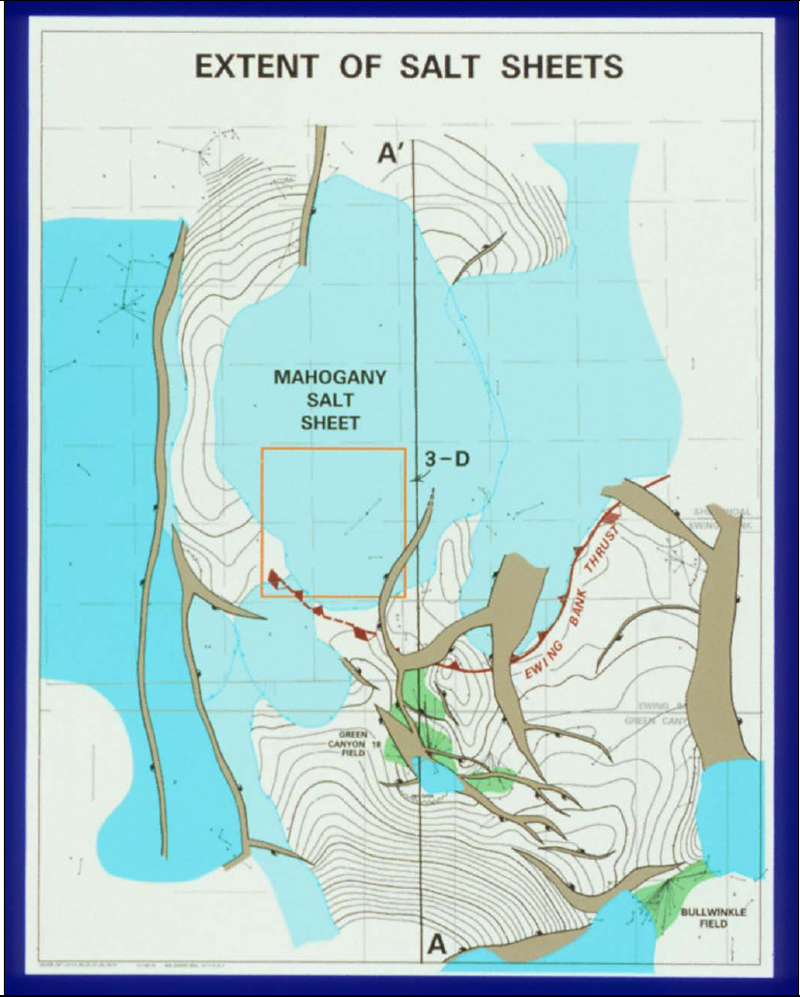
salt![]() . Prestack depth-migrated 3-D seismic data was integrated into a regional geologic model that was based on 2-D time-migrated data. Regionally, the area is characterized by multiple
. Prestack depth-migrated 3-D seismic data was integrated into a regional geologic model that was based on 2-D time-migrated data. Regionally, the area is characterized by multiple ![]() salt
salt![]() sheets, which form a
sheets, which form a ![]() salt
salt![]() canopy sutured east of Mahogany, and several older and deeper sheets are also identified. Structural and rheological aspects of the thick
canopy sutured east of Mahogany, and several older and deeper sheets are also identified. Structural and rheological aspects of the thick ![]() salt
salt![]() sill have been addressed using selected examples of rotary sidewall cores and data on an anomalous "gumbo" shale immediately below the
sill have been addressed using selected examples of rotary sidewall cores and data on an anomalous "gumbo" shale immediately below the ![]() salt
salt![]() which contributes to the understanding of lateral variations at the base of the allochthonous
which contributes to the understanding of lateral variations at the base of the allochthonous ![]() salt
salt![]() .
.
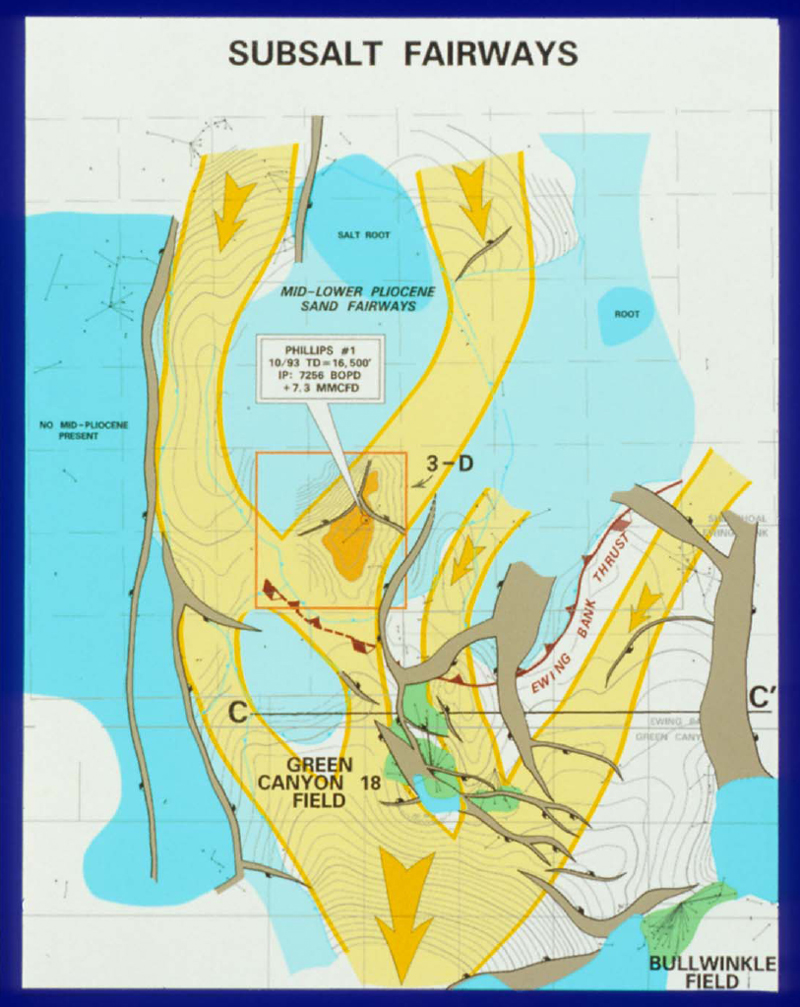
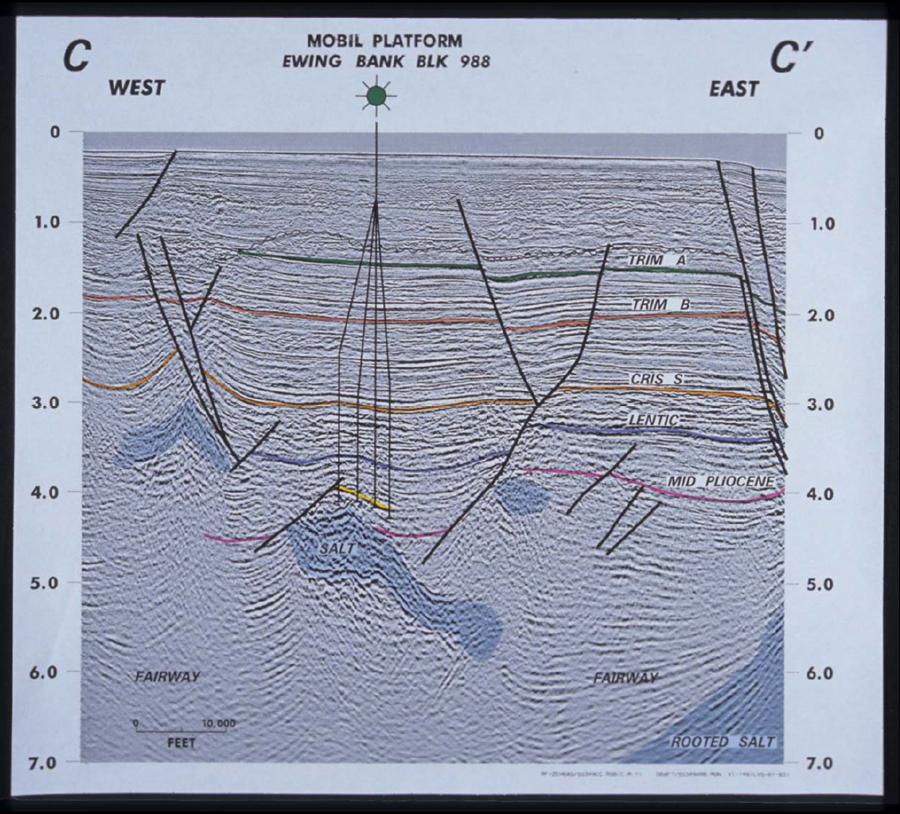
Subsalt depositional fairways can be approximated by ![]() mapping
mapping![]() relative
relative ![]() salt
salt![]() -induced paleo-bathymetry. Deepwater sand fairways are closely related to
-induced paleo-bathymetry. Deepwater sand fairways are closely related to ![]() salt
salt![]() movements and extend under the
movements and extend under the ![]() salt
salt![]() sheets. Depositional environments and reservoir parameters in productive sandstone intervals have been defined using whole core and well log imaging.
sheets. Depositional environments and reservoir parameters in productive sandstone intervals have been defined using whole core and well log imaging.
|
|
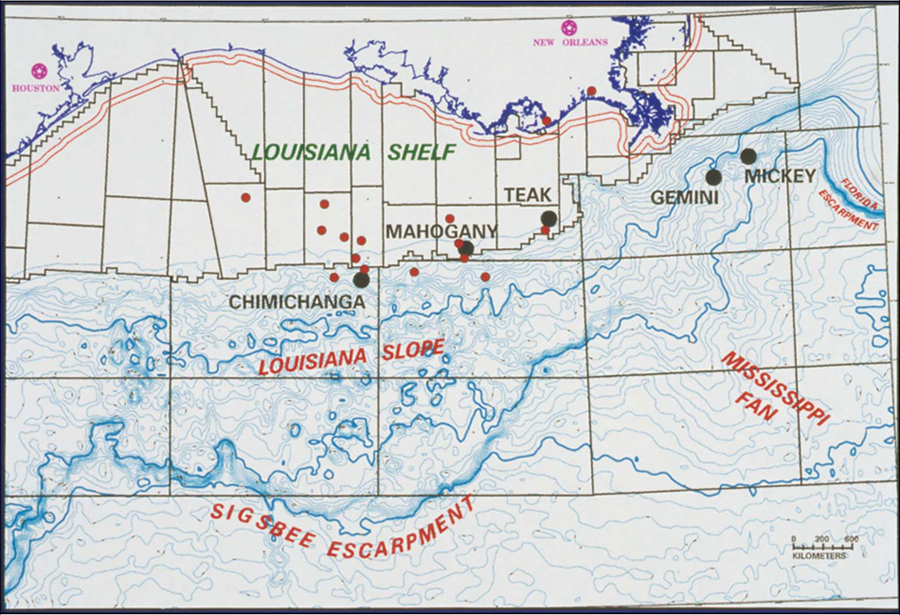
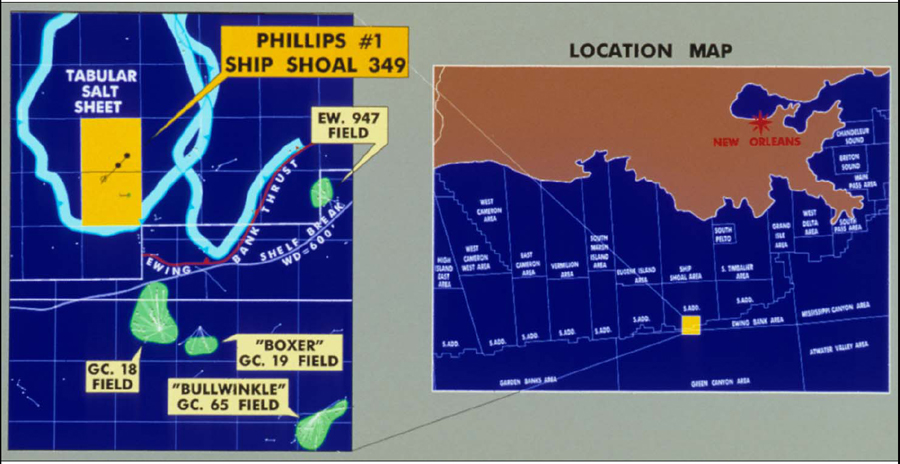
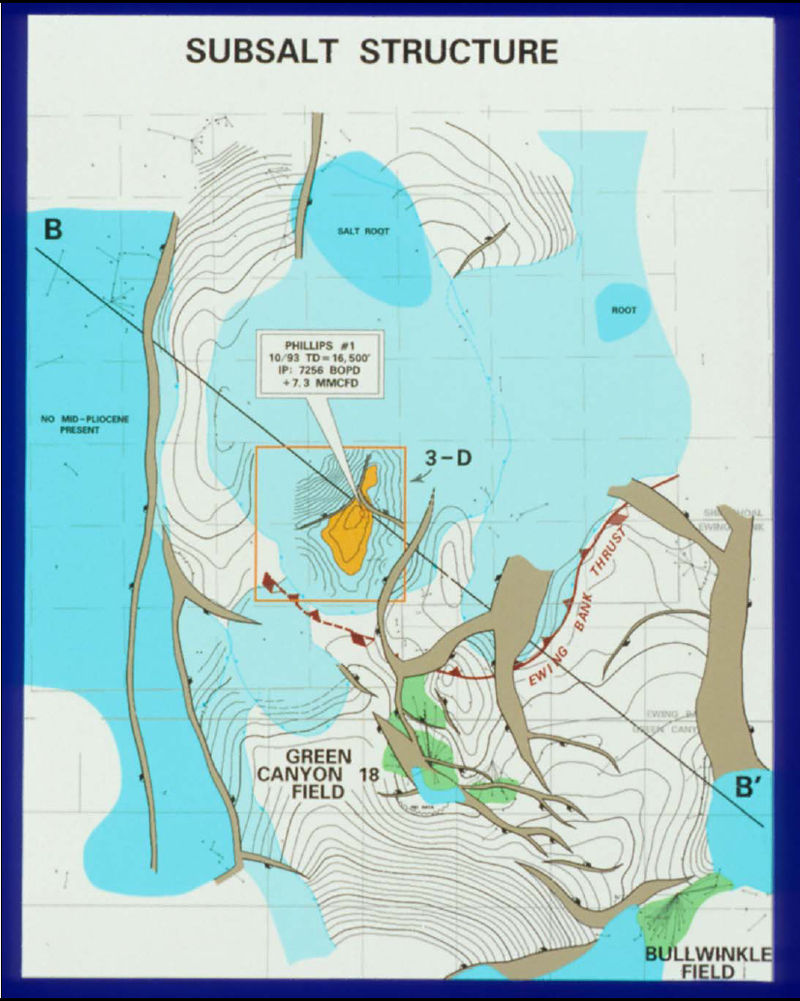
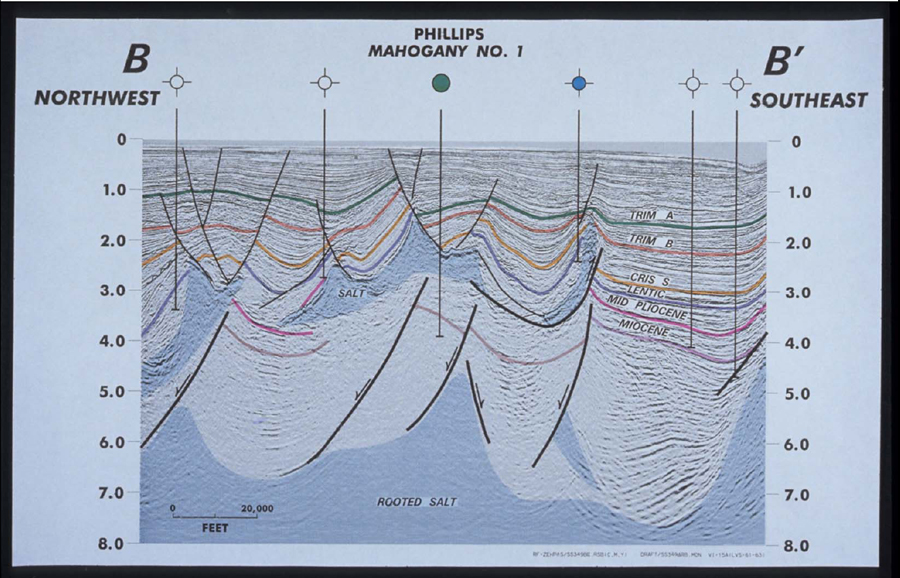
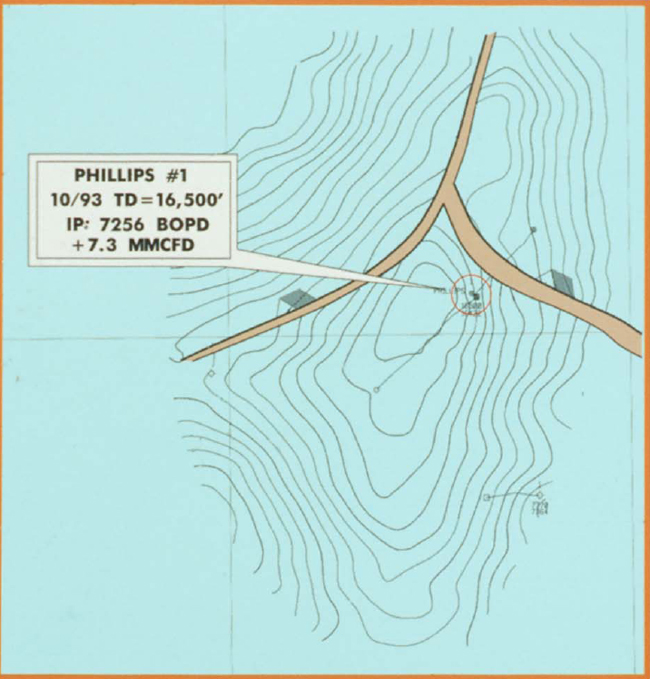
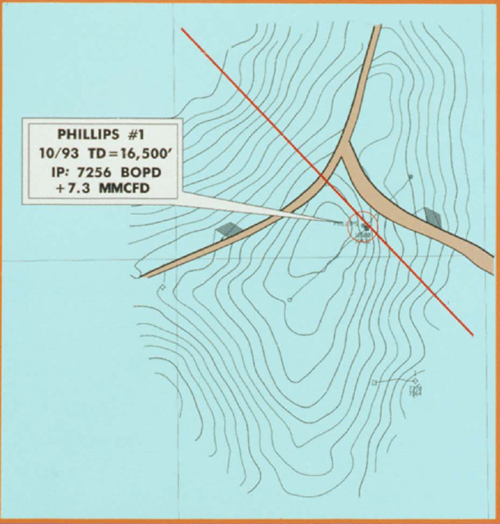
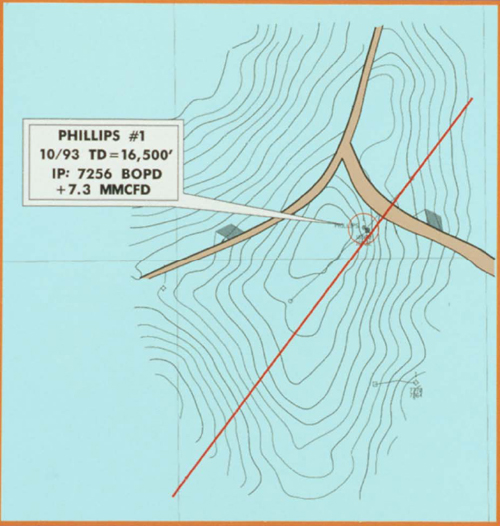
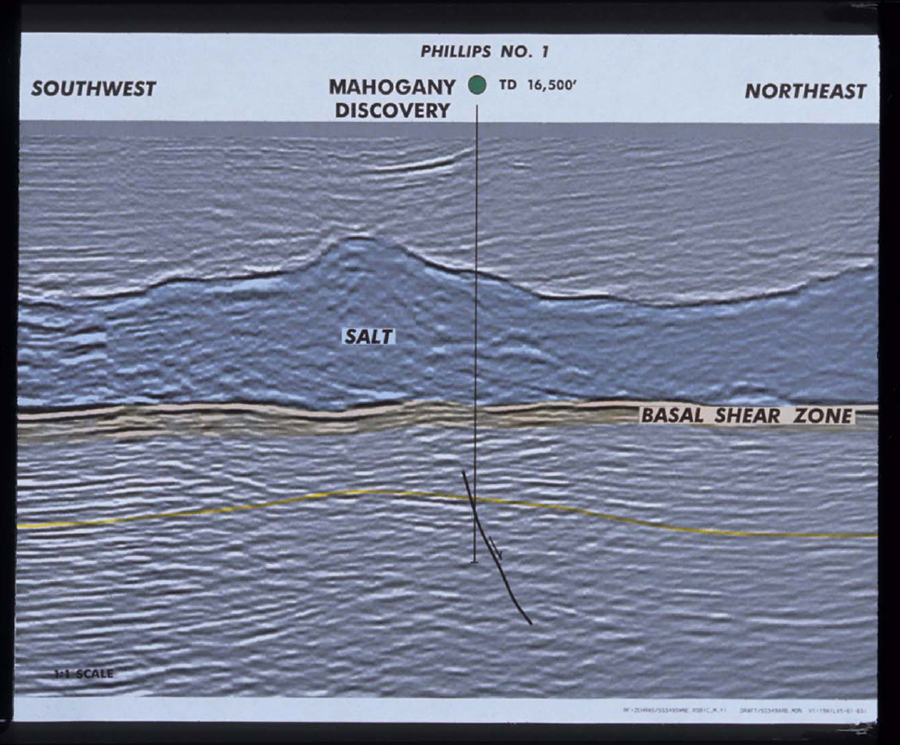
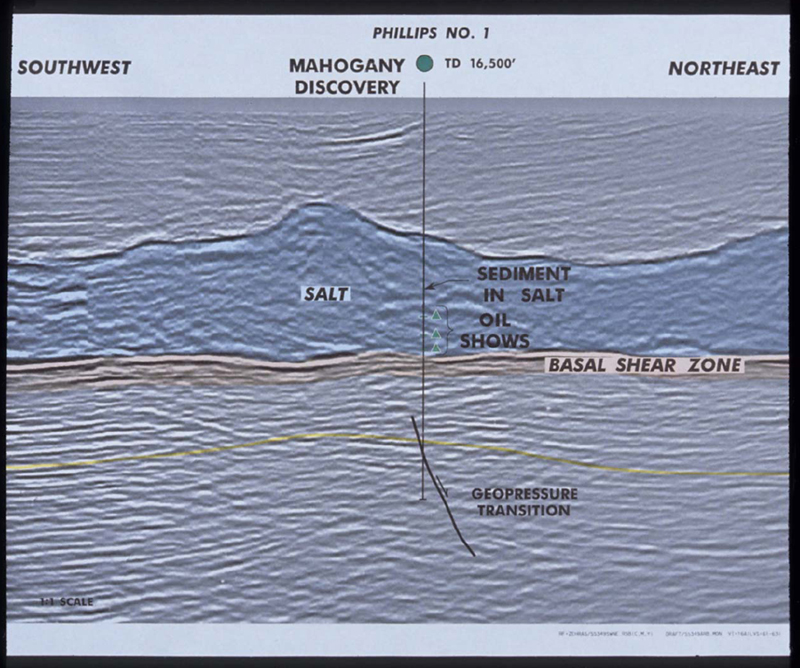
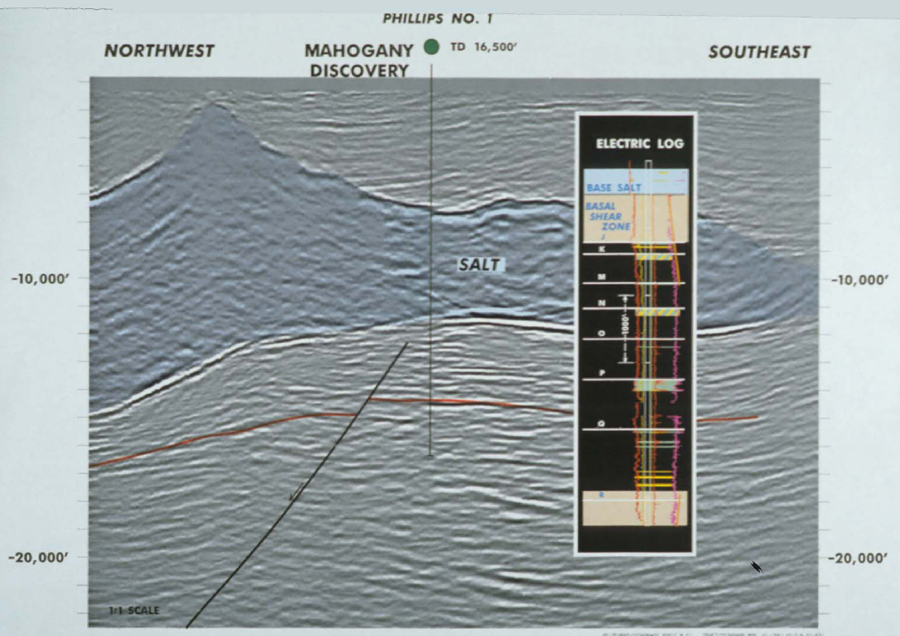
Exploration for hydrocarbons below In 1990, Exxon announced a subsalt discovery in water depths over 4300 ft deep in Mississippi Canyon block 211 named Mickey. Although this was the first discovery of the subsalt play, it was the Mahogany discovery in 1993 that sparked the play to new heights because it was the first commercial discovery (Figures 1 and 2). The field's commerciality is enhanced by its proximity to existing shelf infrastructure and moderate (370 ft) water depths.
This article discusses the regional geologic setting of the subsalt reservoirs and the relationship of depositional fairways to paleo-bathymetric geometry as a function of paleo-
Mahogany is on trend with Bullwinkle, Boxer, and Green Canyon 18 fields near the edge of the shelf/slope break (Figure 2). The field is below a large tabular
Prior to the emplacement of the allochthonous
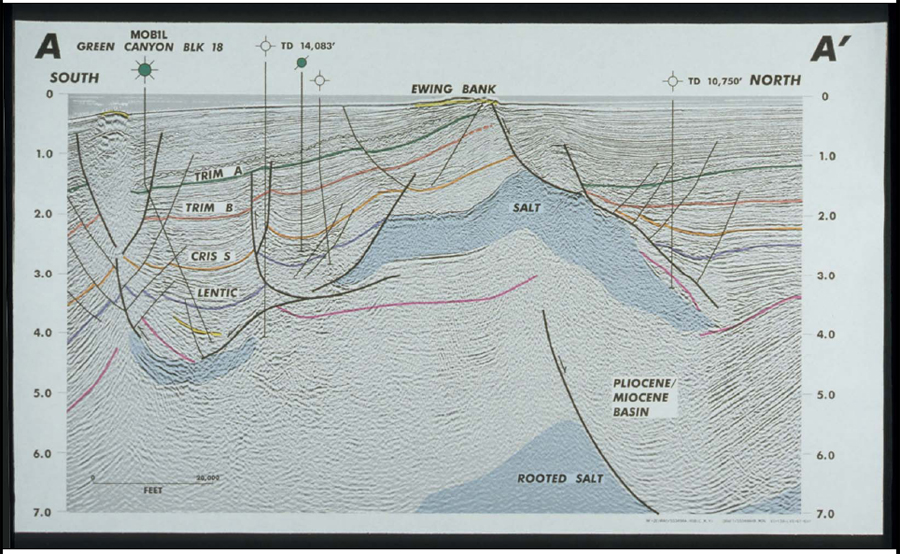
The structure at Mahogany is interpreted as a 3-way dipping anticline (Figures 9, 10, 11, 12, and 13). The closure on the northwest
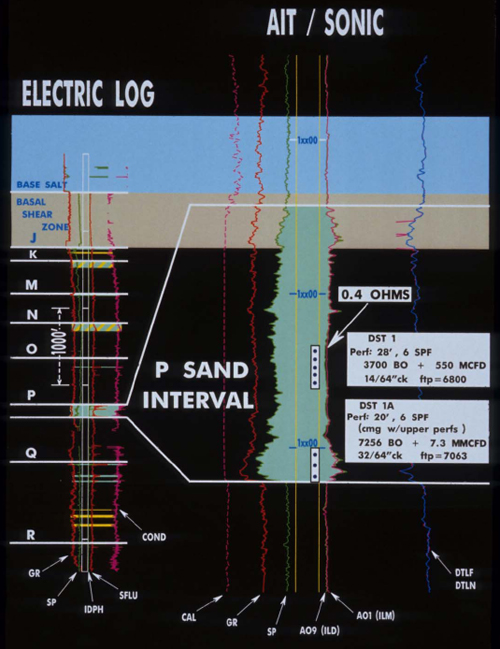
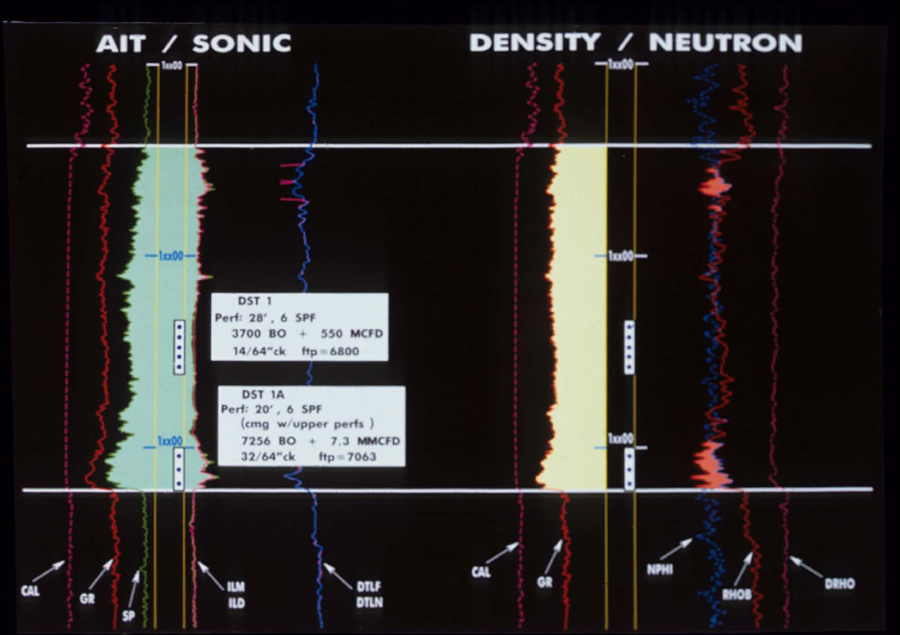
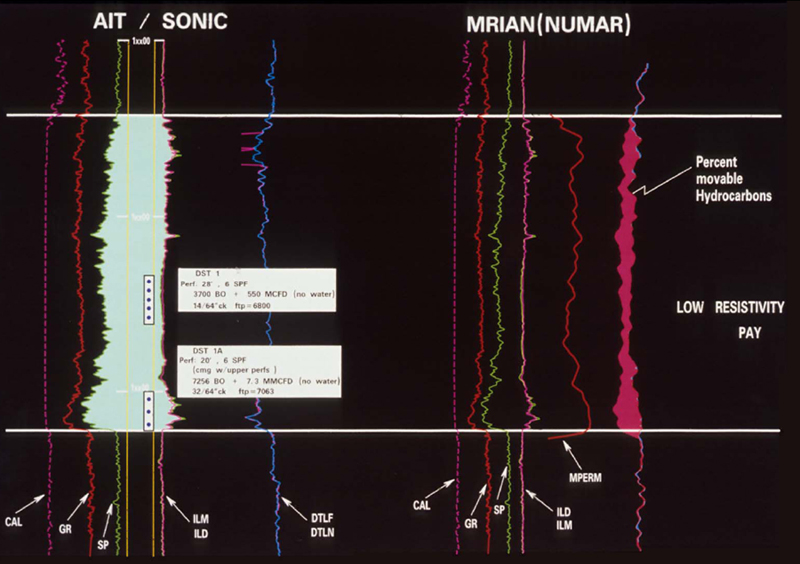
Although The primary subsalt pay sand was flow tested in two stages. DST 1 from perforations of a low resistivity interval flowed 3700 BO and 550 MCFD (Figures 17, 18, and 19). Perforations at the base of the sand (from coarser, thicker bedded subunit) were then added, and the commingled flow rate was 7256 BO and 7.3 MMCFD on a 32/64" choke at 7063 PSI flowing tubing pressure (Figures 17, 18, 19, 20, and 21). The low resistivity log response of the pay sand is due to fine interlaminations of sand and shale (Figures 20 and 21). The Formation MicroImaging log and percussion sidewall cores reveal individual sand laminae less than 0.25 in. thick; yet the overall laminated sequence is capable of significant flow rates. Overall, the sand has a fining-upward texture with a more coarse-grained and thicker bedded layer at the base (Figures 22 and 23), overlain by an extensive rippled and highly laminated, low-resistivity sand and silt interval (Figures 24, 25, 26, 27, and 28), with channel and laminated sands at the top (Figures 29 and 30). Phillips Production Company and partners Anadarko Petroleum Corporation and Amoco Production Company have drilled three oil wells at Mahogany-a straight-hole discovery well, and two directional wells are drilled-to the northeast and to the southwest. A fourth delineation well was spudded in May, 1995. Development plans include installing a platform with a production capacity of 45,000 BOPD and 100 MMCFD. First production is scheduled in December, 1996, with anticipated initial flow rate of about 22,000 BOPD and 30 MMCFD, making it the first subsalt oil development in the Gulf of Mexico.
The major conclusions about the Mahogany Subsalt Discovery are:
Darling, H.L., and R.M. Sneider, 1993, Productive low resistivity well logs of offshore Gulf of Mexico: causes and analysis, in Moore, D.C., ed., Productive low resistivity wcl110gs of the offshore Gulf of Mexico: New Orleans Geological Society and Houston Geological Society Special Publication, p. B-1 - B-26.
Fletcher, R. C., M. R. Hudec, and I. A. Watson, 1995,
Moore, D.C., and R. Brooks, 1995. The evolving exploration of the sub-
Huber. W.F., 1989, Ewing Bank thrust fault zone Gulf of Mexico and its relationship to Shew, R.D., D.R. Rollins, G.M. Tiller, C.J. Hackbarth, and C.D. White. 1994, Characterization and modeling of thin-bedded turbidite deposits from the Gulf of Mexico using detailed subsurface and analog data: Gulf Coast Section Society of Economic Paleontologists and Mineralogists (GCSEPM)15th Annual Research Conference. p. 327-334.
Wu, S., A.W. Bally, and C. Cramez, 1990, Allochthonous Used with permission of GCSSEPM Foundation whose permission is required for further use.
Copyright © AAPG. Serial rights given by author. For all other rights contact author directly. |