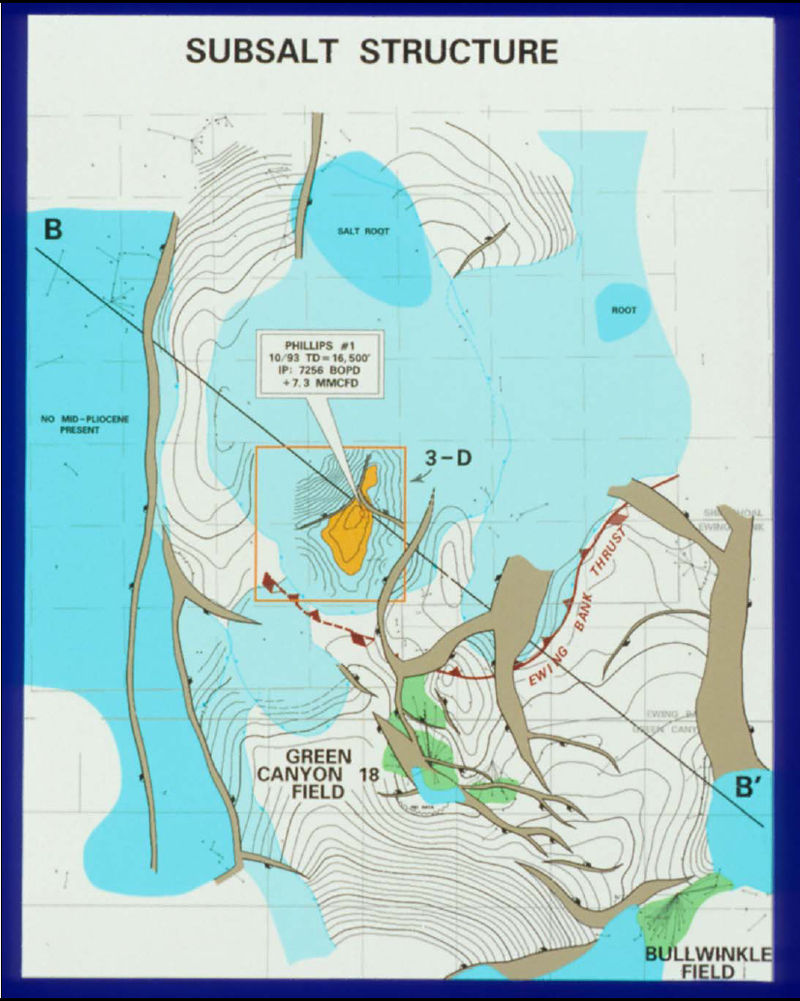
Figure 5. Subsalt structure map. Deep salt features under allochthonous salt on 2-D data can be mapped and tied with regional mapping in the area. Line B-B’ runs from a deep basin in the SW to a deep basin in the NW. The Ewing Bank thrust terminates along this edge of the salt sheet system and emphasizes the separation of the structures above and below salt.